3.0 Study Guide and Task Sheet: Data Analysis and Visualization
The main study route is now in Chapter 3 entry. Use this page only as a quick checklist while you practice.
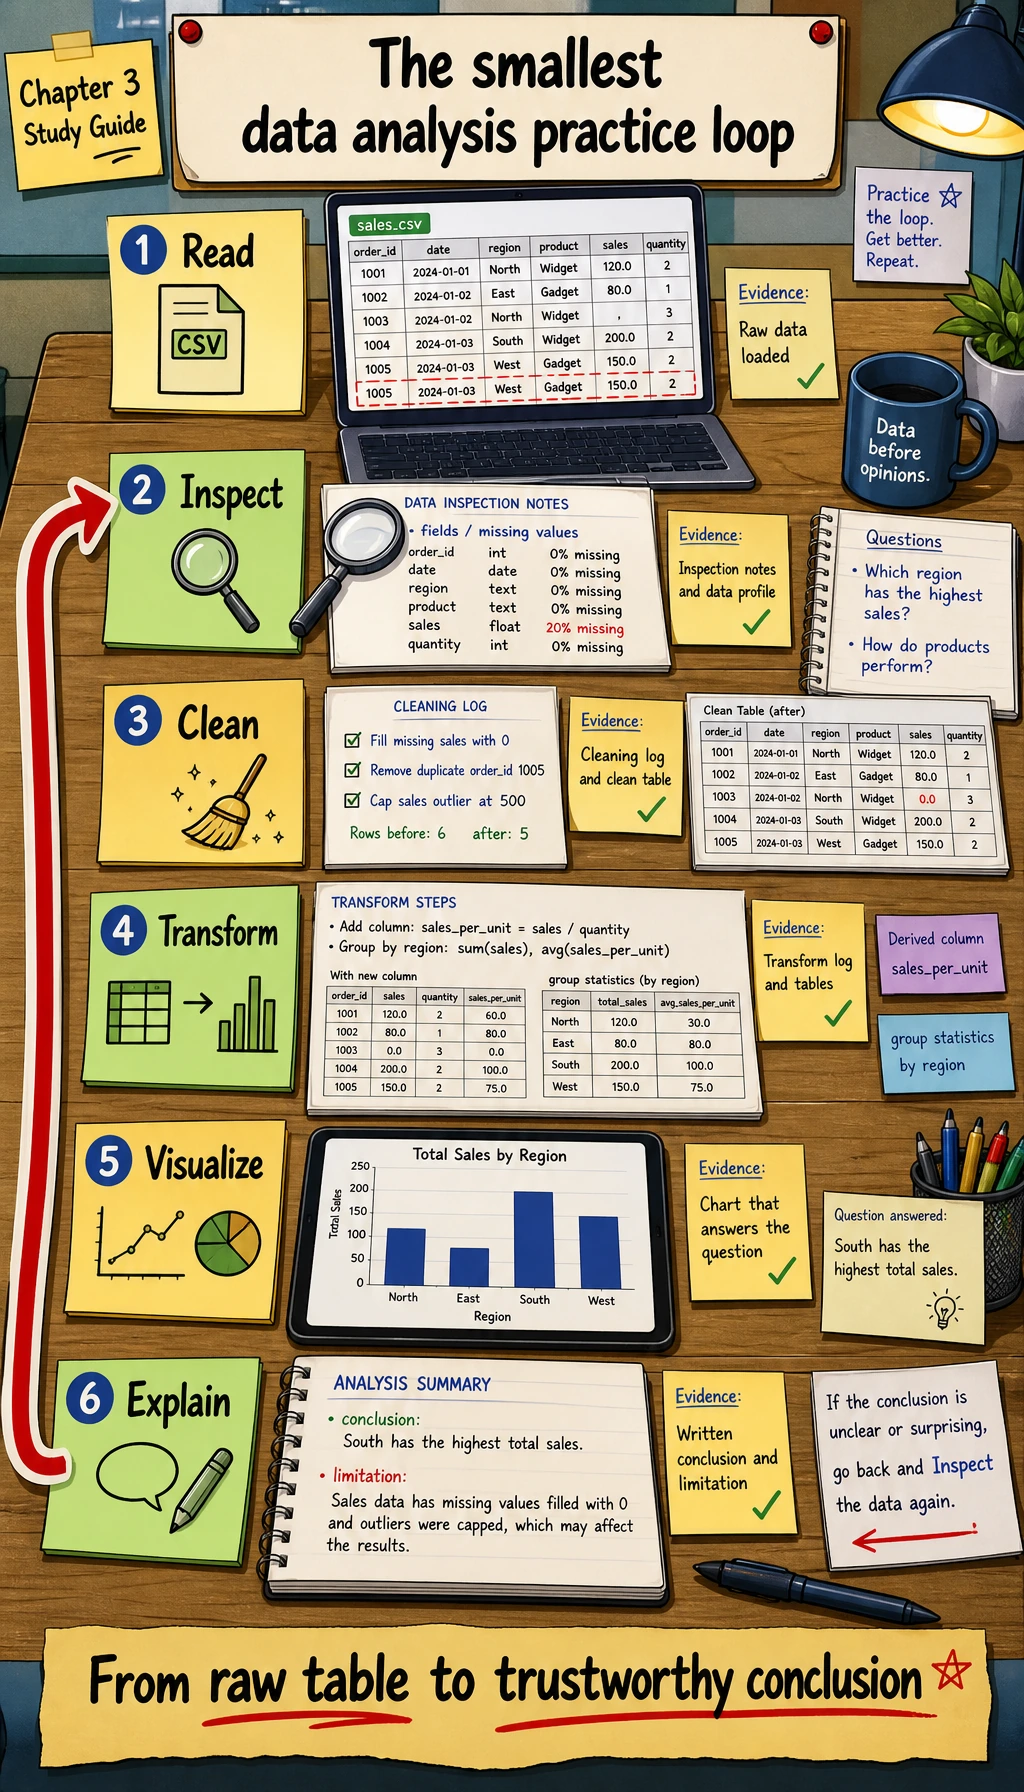
One-Line Mental Model
read -> inspect -> clean -> summarize -> visualize -> explain
If you cannot explain a chart in one sentence, return to the data question.
Practice Checklist
| Check | Evidence |
|---|---|
| I can inspect rows, columns, types, and missing values | df.info() and missing-value notes |
| I can clean duplicates, missing values, and obvious outliers | cleaning log |
I can use groupby to answer a question | summary table |
| I can choose a chart for a specific question | 3 chart files |
| I can state a conclusion and a limitation | report.md |
| I can finish the reproducible workshop | ch03_output/ |
Evidence Rubric
| Artifact | It should answer |
|---|---|
| Data dictionary | What does each column mean, what unit does it use, and where did it come from? |
| Cleaning log | Which rows or values changed, and why was that rule acceptable? |
| Summary table | What numeric pattern supports the answer? |
| Chart | What single question does the visual answer? |
| Limitation note | What could still be wrong because of missing data, sampling, time, or leakage? |
Ready To Continue
Continue to Chapter 4 when one CSV can travel from raw data to cleaned data, summary table, chart, and short written conclusion.