10.0 Learning Checklist: Computer Vision
Use this page as a printable checklist. If you need the full explanation, return to the Chapter 10 entry page.
Two-Hour First Pass
| Time box | Do this | Stop when you can say |
|---|---|---|
| 20 min | Read the output-granularity ladder | "Classification, detection, and segmentation differ by output." |
| 25 min | Run the pixel lab | "I can inspect size, channels, RGB, and grayscale." |
| 25 min | Skim 10.1 image basics | "Preprocessing changes the data the model sees." |
| 25 min | Skim classification, detection, segmentation roadmaps | "I know which metric belongs to which task." |
| 25 min | Read the debugging loop | "I should inspect data and labels before blaming architecture." |
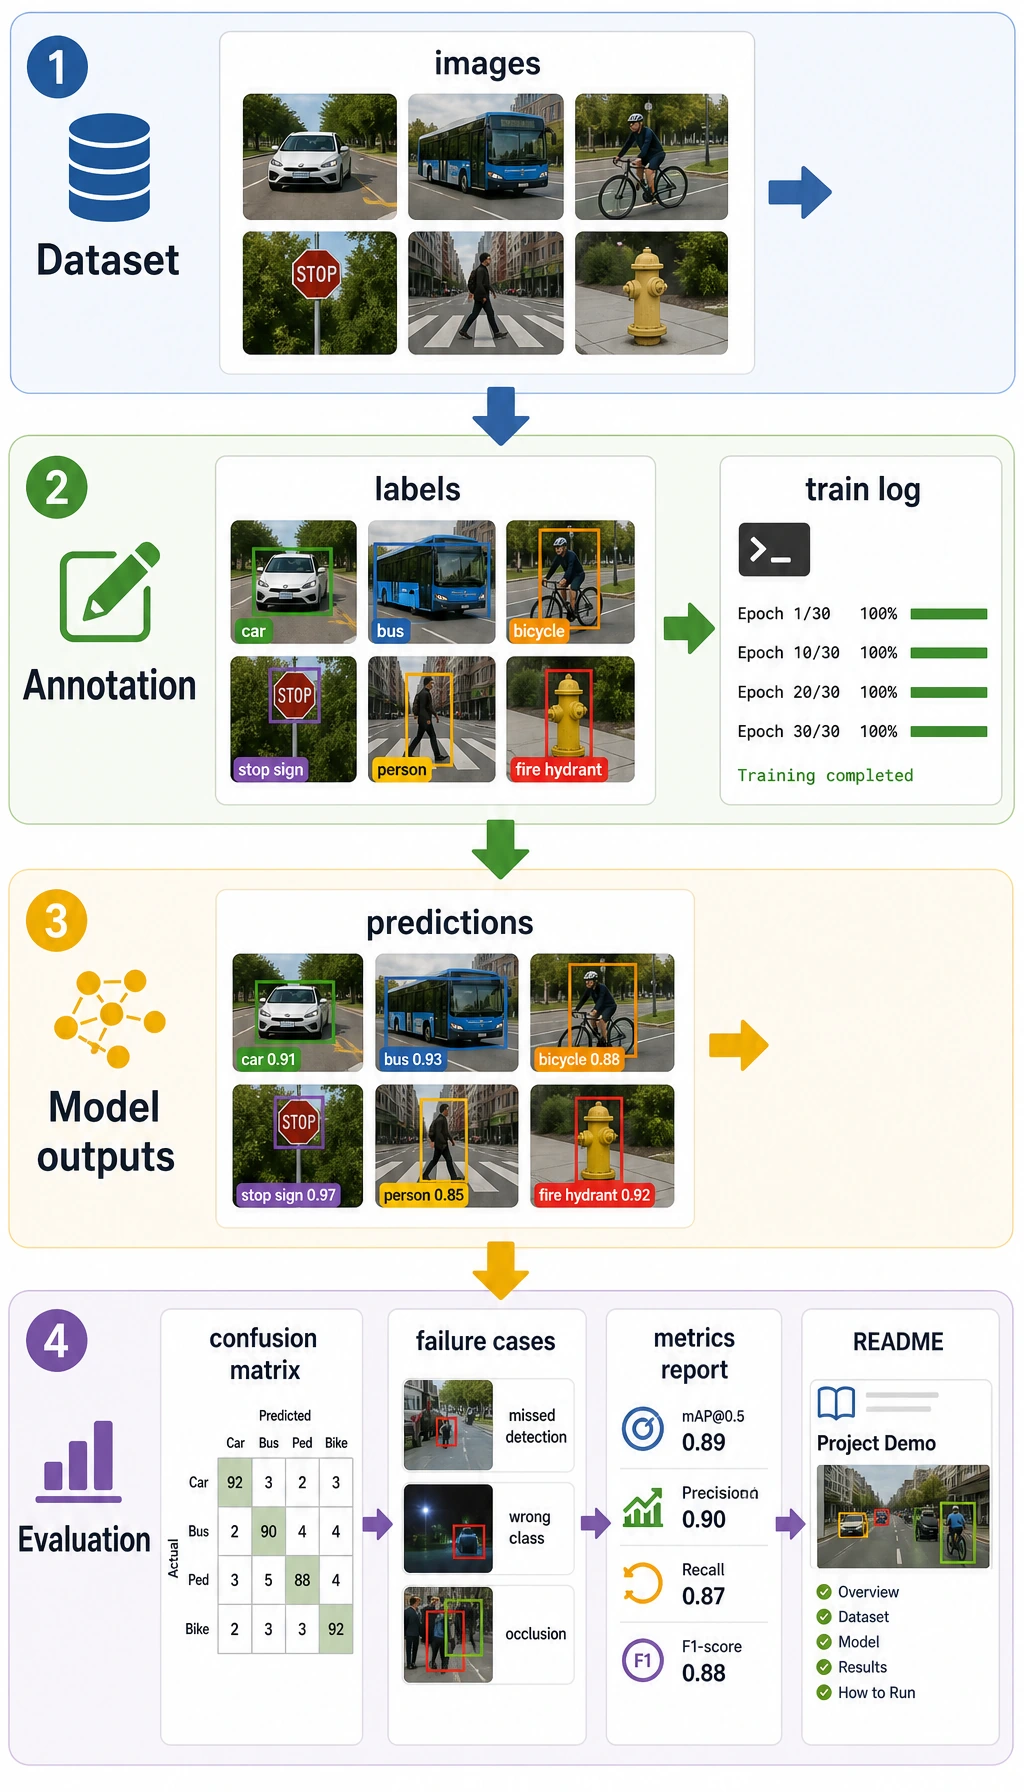
Required Evidence
| Evidence | Minimum version |
|---|---|
opencv_demo.py or pixel_lab.py | image load or generated image, preprocessing, saved output |
vision_dataset.md | data source, classes, sample count, annotation method, limitations |
eval_results.md | accuracy/F1, mAP, IoU/Dice, OCR hit rate, or chosen metric |
failure_cases.md | failed images, possible cause, fix direction |
README.md | task goal, run command, input/output examples, scenario boundary |
Quality Gates
| Gate | Pass condition |
|---|---|
| Visual trace | Original, processed, prediction, and failure images are saved with matching filenames. |
| Annotation | Dataset notes define classes, boxes or masks, source, split, and known label uncertainty. |
| Metric fit | Accuracy/F1, mAP, IoU/Dice, or OCR hit rate matches the task output. |
| Real-world boundary | Report names lighting, angle, camera or source, latency, image size, and device limits. |
Exit Questions
- Can you explain classification, detection, segmentation, and OCR by output shape?
- Can you show the original image, processed image, and prediction visualization?
- Can you explain why annotation quality affects metrics?
- Can you choose accuracy/F1, mAP, IoU, or Dice for the right task?
- Can you explain why a demo may fail on real images?
If the answer is yes, you can connect vision to multimodal work in Chapter 12.