4 AI Math: the Minimum Necessary Foundation
Chapter 4 has one job: make the math inside models feel like tools you can run and explain, not a wall of formulas.
Where You Are In The Main Route
Section titled “Where You Are In The Main Route”You have already built a basic coding and data-analysis workflow. This chapter turns that work into model language: data becomes vectors or matrices, uncertainty becomes probability, mistakes become loss, and improvement becomes gradient-based updates.
You do not need to become a mathematician before continuing. You need to run the smallest examples, read the output, and explain which model action each formula supports. Chapter 5 will use this foundation to train and evaluate sklearn models.
See The Model Math Loop
Section titled “See The Model Math Loop”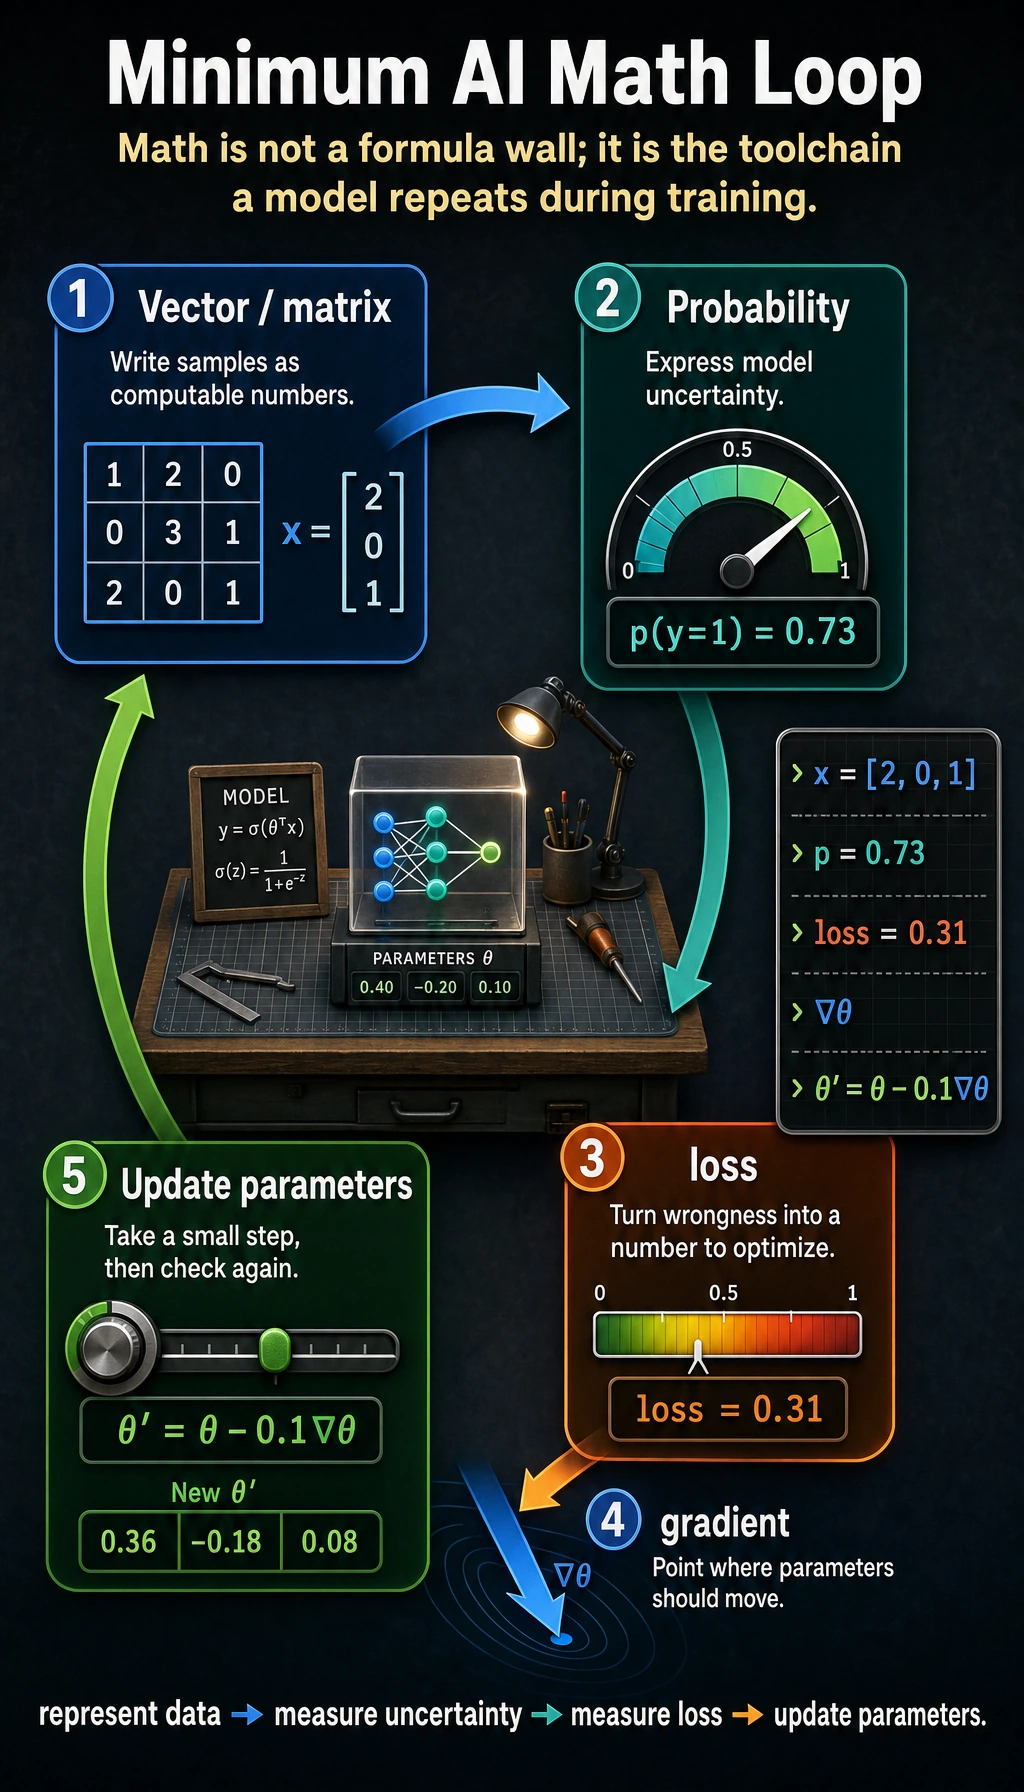
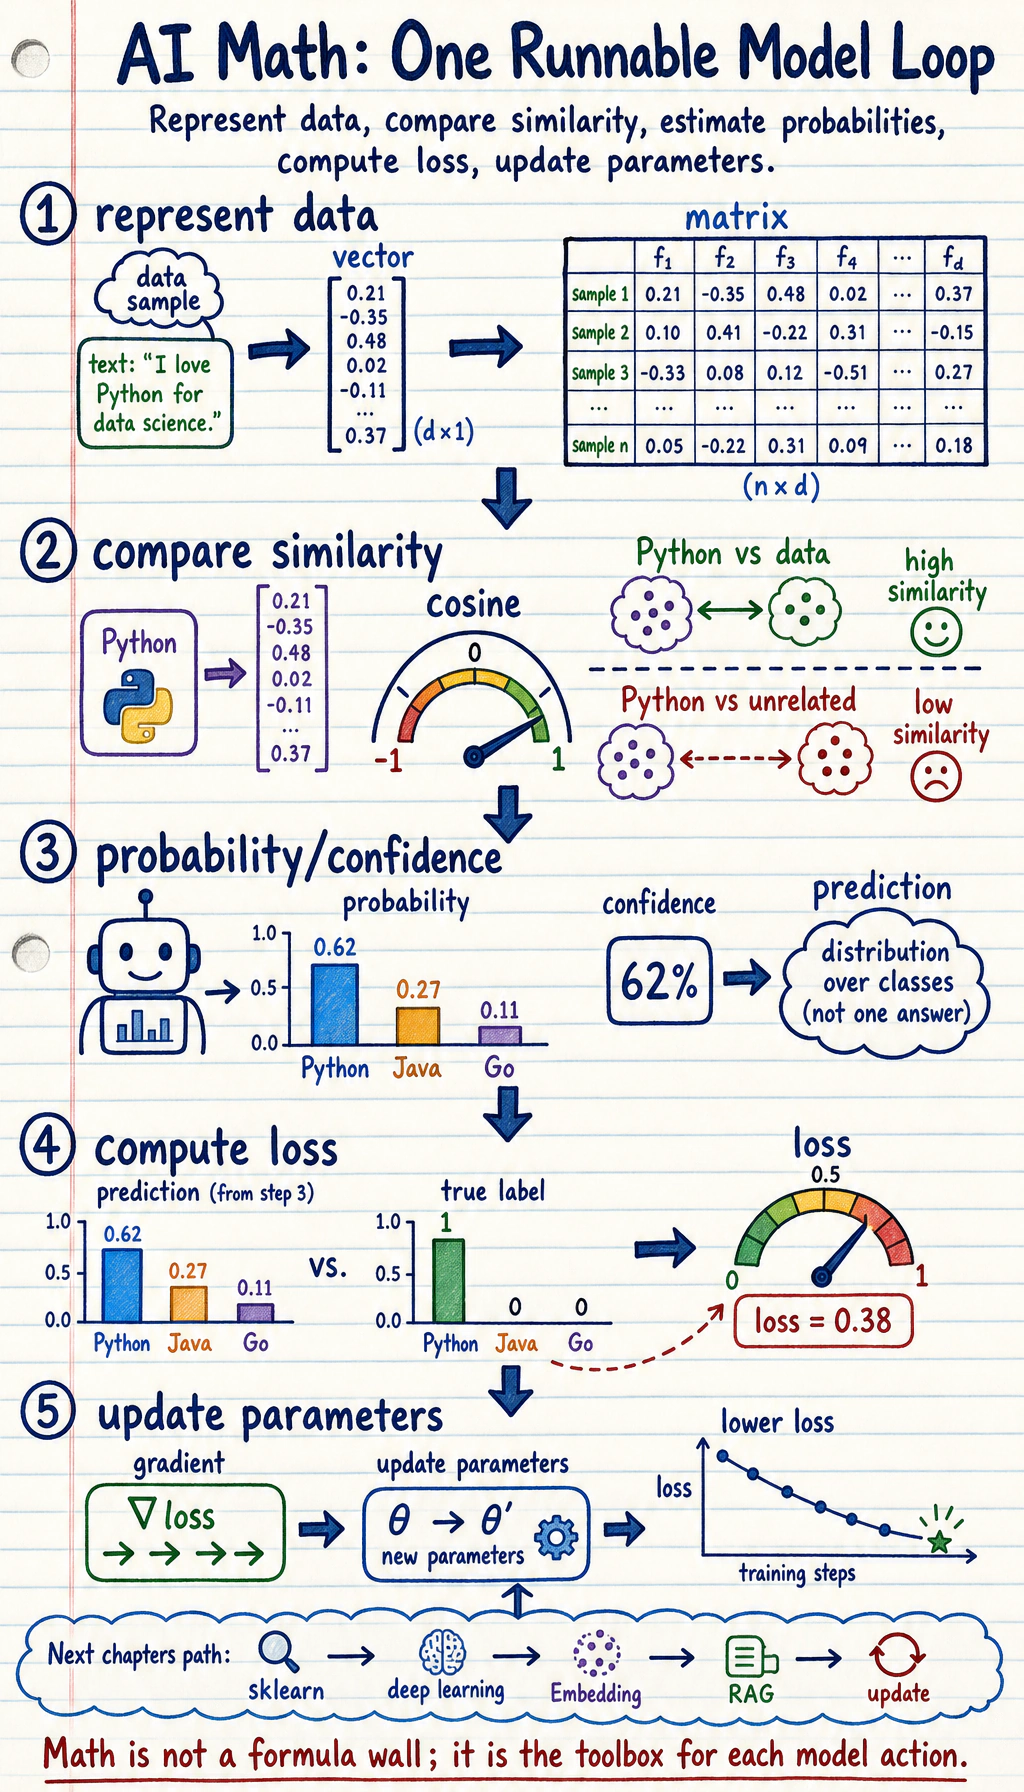
Read the picture first. Most AI math in this course supports one loop:
Vectors and matrices represent data. Probability describes uncertainty. Loss tells the model how wrong it is. Gradients tell it how to improve.
Learning Order And Task List
Section titled “Learning Order And Task List”Study the theory first, then run the full workshop. The workshop is last because it combines the ideas rather than introducing them from zero.
- 4.1 Linear Algebra: compare examples with vectors, matrices, dot product, norm, and cosine similarity.
- 4.2 Probability and Statistics: simulate uncertainty, distributions, mean, variance, entropy, and loss.
- 4.3 Calculus and Optimization: trace derivatives, gradients, learning rate, and gradient descent.
- 4.4 Hands-on Math Workshop: connect the whole chain in one runnable script and keep
ch04_math_workshop_evidence/.
Core Path, Extensions, And Depth
Section titled “Core Path, Extensions, And Depth”| Layer | What to study now | How to use it |
|---|---|---|
| Required core | Vector similarity, matrix shape, probability intuition, loss, gradient descent | These ideas become features, metrics, embeddings, retrieval scores, and training updates later |
| Optional extension | Eigenvalues, vector spaces, history and foundations | Return here when PCA, representation geometry, or model-history questions appear |
| Depth challenge | Change one input, probability, loss, or learning rate and predict the result before running code | This builds the habit of reasoning before experimenting |
Key terms for this chapter:
| Term | Meaning |
|---|---|
Embedding | A vector representation of text, images, users, or items |
dot product | How much two vector directions agree |
norm | Vector length or strength |
entropy | Uncertainty or surprise |
loss | A number that measures model error |
gradient | The direction that changes a value fastest |
GD / SGD | Gradient descent / stochastic gradient descent: walking downhill on loss |
First Runnable Loop
Section titled “First Runnable Loop”Install NumPy if needed:
python -m pip install numpyThen run this script. It shows why vector similarity matters before you meet Embeddings and retrieval.
import numpy as np
python_topic = np.array([1.0, 1.0, 0.0])data_topic = np.array([1.0, 0.8, 0.2])unrelated_topic = np.array([0.0, 0.1, 1.0])
def cosine(a, b):    return a @ b / (np.linalg.norm(a) * np.linalg.norm(b))
print("Python vs data:", round(cosine(python_topic, data_topic), 3))print("Python vs unrelated:", round(cosine(python_topic, unrelated_topic), 3))
Expected output:
Python vs data: 0.982Python vs unrelated: 0.071The code is small, but the idea returns later in Embeddings, retrieval, recommendation, attention, and RAG.
How to read this output
Section titled “How to read this output”0.982means the two vectors point in a very similar direction.0.071means the unrelated vector is nearly orthogonal to the Python topic.- The numbers are not magic scores; they come from dot product divided by vector lengths.
- Change one dimension and predict the direction before running the code again.
Depth Ladder
Section titled “Depth Ladder”| Level | What you can prove |
|---|---|
| Minimum pass | You can run a vector similarity example and explain what each dimension means. |
| Project-ready | You can connect vector, probability, loss, and gradient to one model action instead of treating them as separate formulas. |
| Deeper check | You can change one input or learning rate, predict the direction of the result, then verify it with code. |
Evidence to Keep
Section titled “Evidence to Keep”Keep this page’s proof of learning as a small evidence card:
- Concept Bridge
- which math idea supports model training or AI applications
- Calculation
- small hand/NumPy example that can be checked
- Output
- number, curve, vector, matrix, probability, or gradient trace
- Failure Check
- memorizing formula without knowing the model behavior it explains
- Expected Output
- math note that explains one real AI operation
Common Failures
Section titled “Common Failures”| Symptom | First thing to check | Usual fix |
|---|---|---|
| Formula feels abstract | What model action does it support? | Translate it into represent, compare, measure uncertainty, measure loss, or update |
| Vector examples feel arbitrary | What does each dimension mean? | Write labels for dimensions before calculating |
| Probability terms blur together | What is random, and what is the event? | List samples, outcomes, and probabilities in a tiny table |
| Gradient descent diverges | Learning rate is too large | Plot or print loss each step and lower the rate |
| Workshop feels like magic | Theory was skipped | Read the 4.1, 4.2, and 4.3 roadmap pages first |
Pass Check
Section titled “Pass Check”Move to Chapter 5 when you can answer these five questions:
- How can one sample become a vector?
- Why can a model output be read as probability or confidence?
- What does loss measure?
- How does a gradient tell parameters which way to move?
- Can you run 4.4 Hands-on Math Workshop and explain the generated files?
For a printable checklist, use 4.0 Study Guide and Task Sheet. The next chapter grounds these math ideas in sklearn model training and evaluation.
Check reasoning and explanation
- A complete pass check connects formula, code, and model behavior. Do not stop at “I know the equation”; show one small calculation and the AI task it explains.
- For vectors and matrices, the evidence should include a shape check and a similarity or transformation result. For probability, show a repeated-sample estimate or Bayes update. For calculus, show a gradient and one update step.
- If you cannot explain what a number means in plain language, keep the chapter open and add a visual or tiny NumPy example.