5.4.4 Bias-Variance Tradeoff
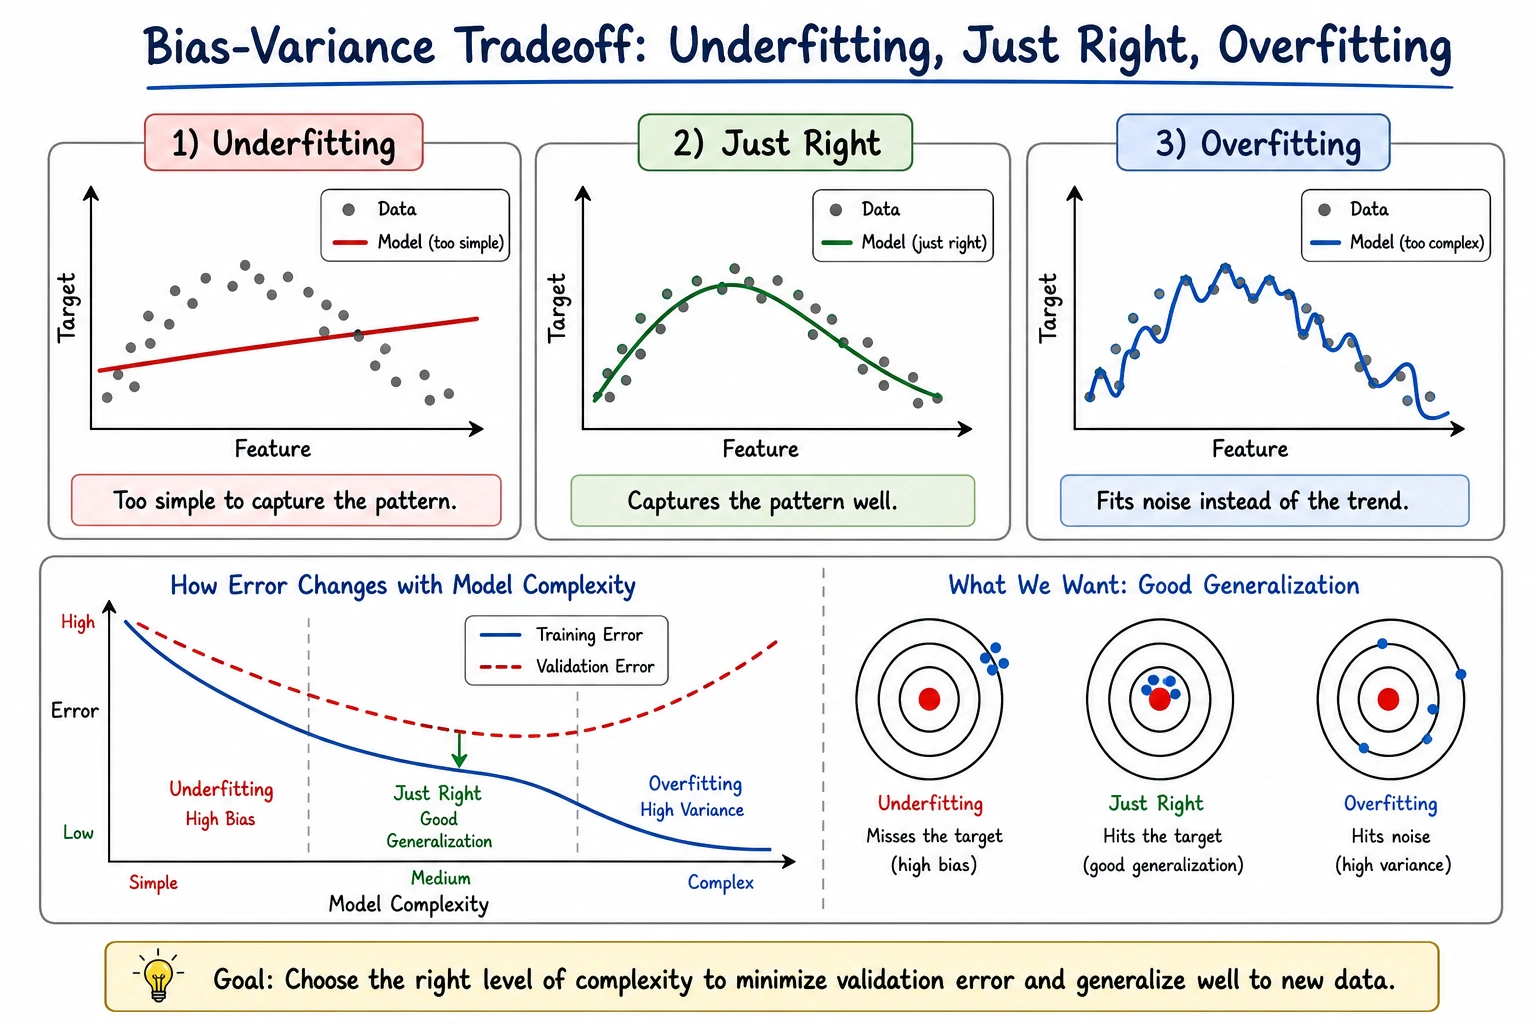
Bias and variance are not just theory words. They are a way to diagnose whether your model is too simple, too unstable, or limited by data quality.
What You Will Build
This lesson uses decision trees to show:
- how model complexity changes train and test scores;
- how to identify underfitting and overfitting from the train-test gap;
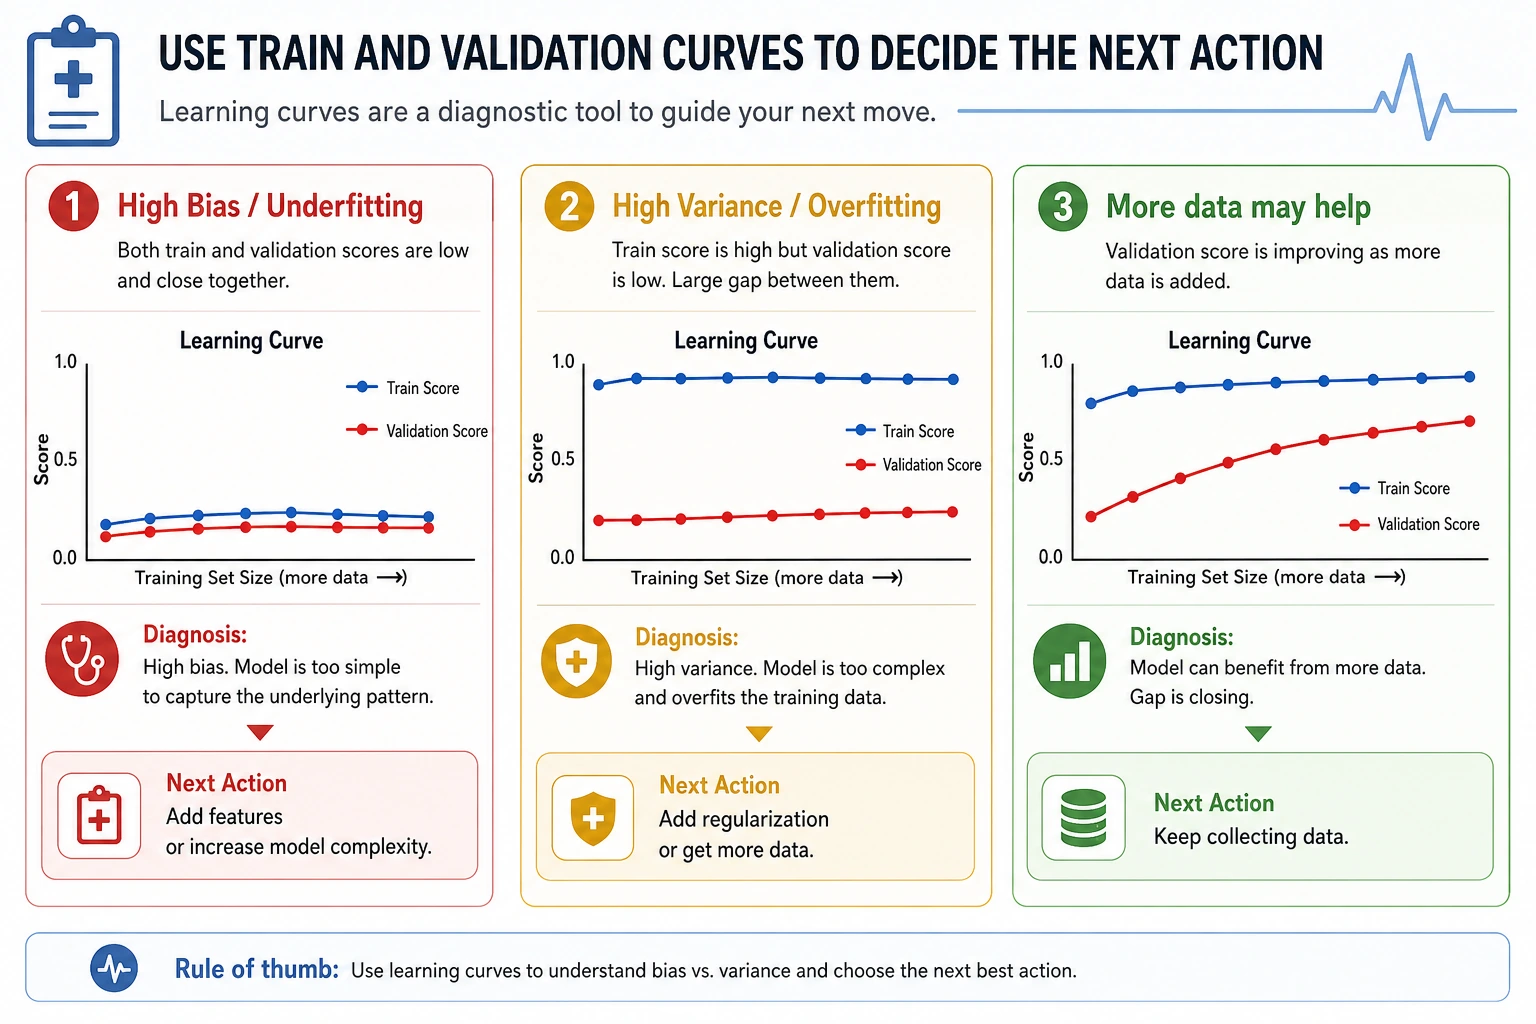
- how learning curves show whether more data may help;
- what action to take for high bias vs high variance.
Setup
python -m pip install -U scikit-learn numpy
Run the Complete Lab
Create bias_variance_lab.py:
import numpy as np
from sklearn.datasets import load_breast_cancer
from sklearn.metrics import accuracy_score
from sklearn.model_selection import learning_curve, train_test_split
from sklearn.tree import DecisionTreeClassifier


X, y = load_breast_cancer(return_X_y=True)
X_train, X_test, y_train, y_test = train_test_split(
    X, y, test_size=0.25, random_state=42, stratify=y
)

print("complexity_lab")
for depth in [1, 3, 5, None]:
    model = DecisionTreeClassifier(max_depth=depth, random_state=42)
    model.fit(X_train, y_train)
    train_acc = accuracy_score(y_train, model.predict(X_train))
    test_acc = accuracy_score(y_test, model.predict(X_test))
    gap = train_acc - test_acc
    print(
        f"max_depth={str(depth):<4} "
        f"train={train_acc:.3f} test={test_acc:.3f} gap={gap:.3f} "
        f"leaves={model.get_n_leaves()}"
    )

print("learning_curve_lab")
model = DecisionTreeClassifier(max_depth=3, random_state=42)
train_sizes, train_scores, val_scores = learning_curve(
    model,
    X,
    y,
    cv=5,
    train_sizes=[0.2, 0.4, 0.6, 0.8, 1.0],
    scoring="accuracy",
)
for size, train_mean, val_mean in zip(train_sizes, train_scores.mean(axis=1), val_scores.mean(axis=1)):
    print(f"train_size={size:<3} train={train_mean:.3f} cv={val_mean:.3f} gap={train_mean - val_mean:.3f}")
Run it:
python bias_variance_lab.py
Expected output:
complexity_lab
max_depth=1    train=0.923 test=0.923 gap=-0.001 leaves=2
max_depth=3    train=0.977 test=0.944 gap=0.032 leaves=7
max_depth=5    train=0.995 test=0.937 gap=0.058 leaves=15
max_depth=None train=1.000 test=0.923 gap=0.077 leaves=18
learning_curve_lab
train_size=91  train=0.989 cv=0.847 gap=0.142
train_size=182 train=0.986 cv=0.870 gap=0.116
train_size=273 train=0.978 cv=0.903 gap=0.075
train_size=364 train=0.975 cv=0.917 gap=0.057
train_size=455 train=0.974 cv=0.919 gap=0.055
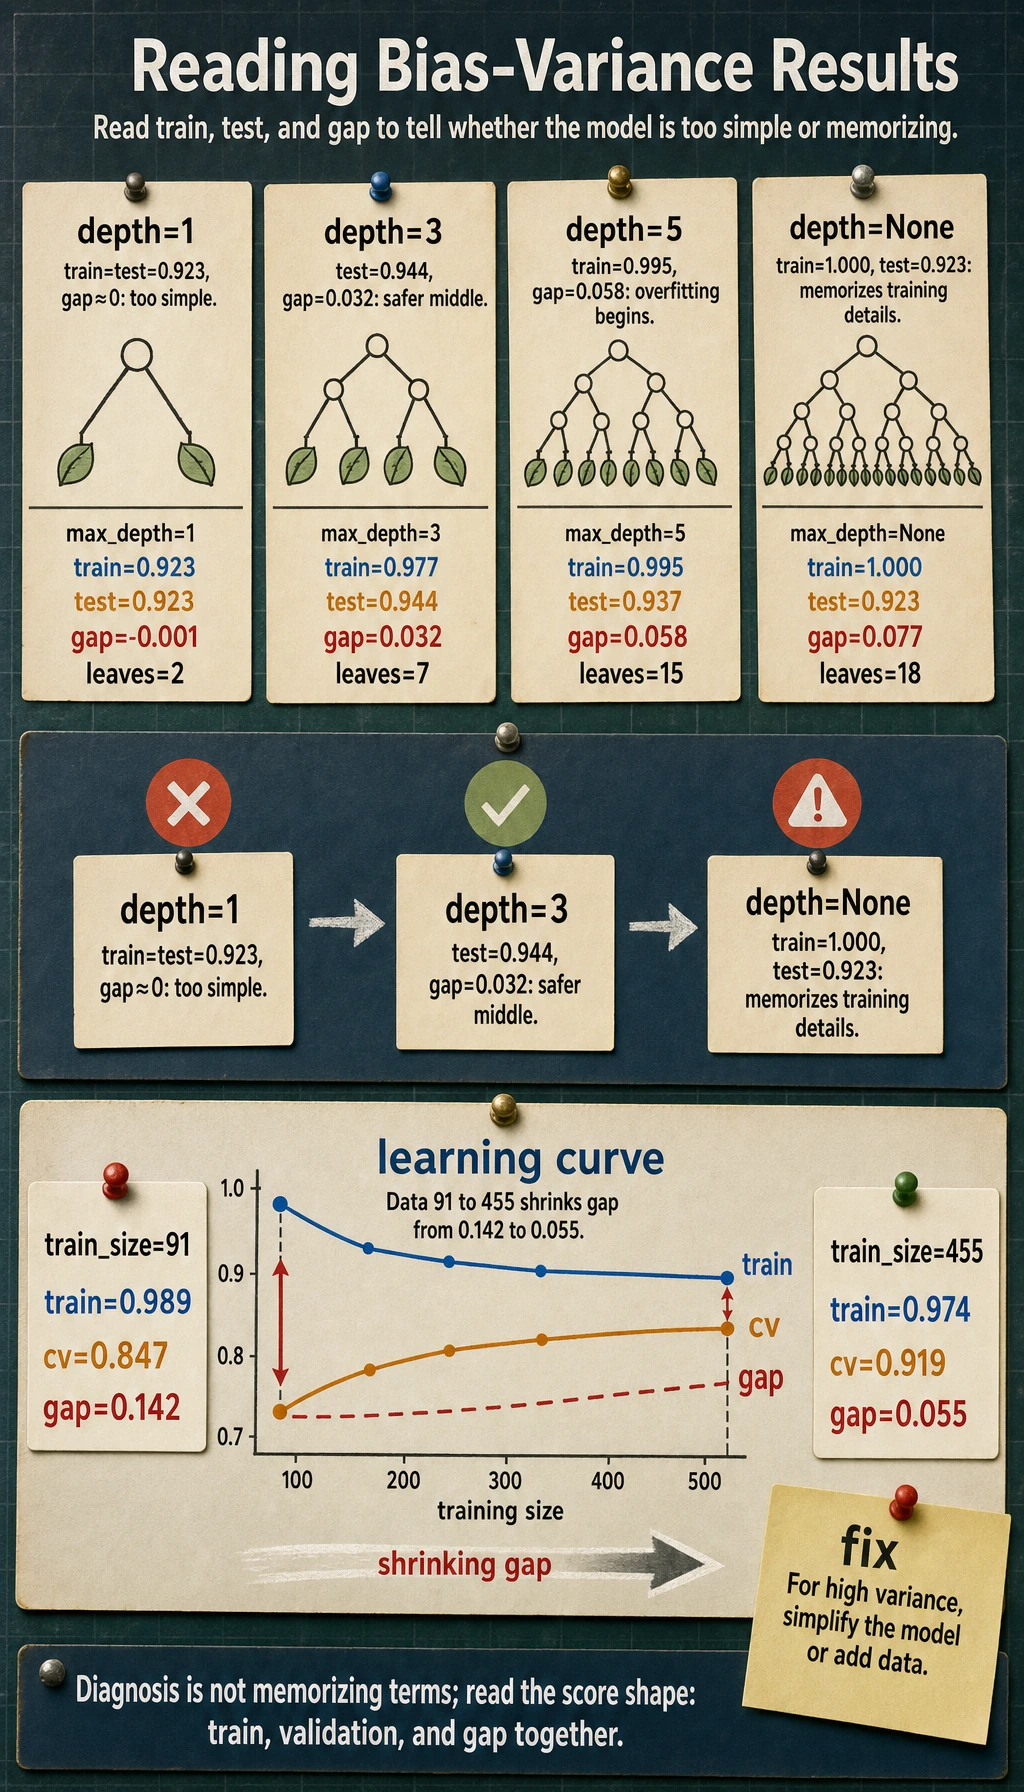
Read the Complexity Lab
The tree becomes more complex as max_depth grows:
max_depth=1    train=0.923 test=0.923 gap=-0.001 leaves=2
max_depth=None train=1.000 test=0.923 gap=0.077 leaves=18
max_depth=1 is simple. Train and test are similar, but the score is not the best. This can be high bias: the model may be too simple.
max_depth=None memorizes training data perfectly, but test accuracy drops. This is high variance: the model fits training details that do not generalize.
The best practical model is often in the middle:
max_depth=3 train=0.977 test=0.944 gap=0.032
It is not perfect on training data, but it generalizes better.
Learning Curves
The learning curve shows what happens when more training data is used:
train_size=91  train=0.989 cv=0.847 gap=0.142
train_size=455 train=0.974 cv=0.919 gap=0.055
As data grows, validation score improves and the gap shrinks. That suggests more data may help, but the model still has room for better features or tuning.
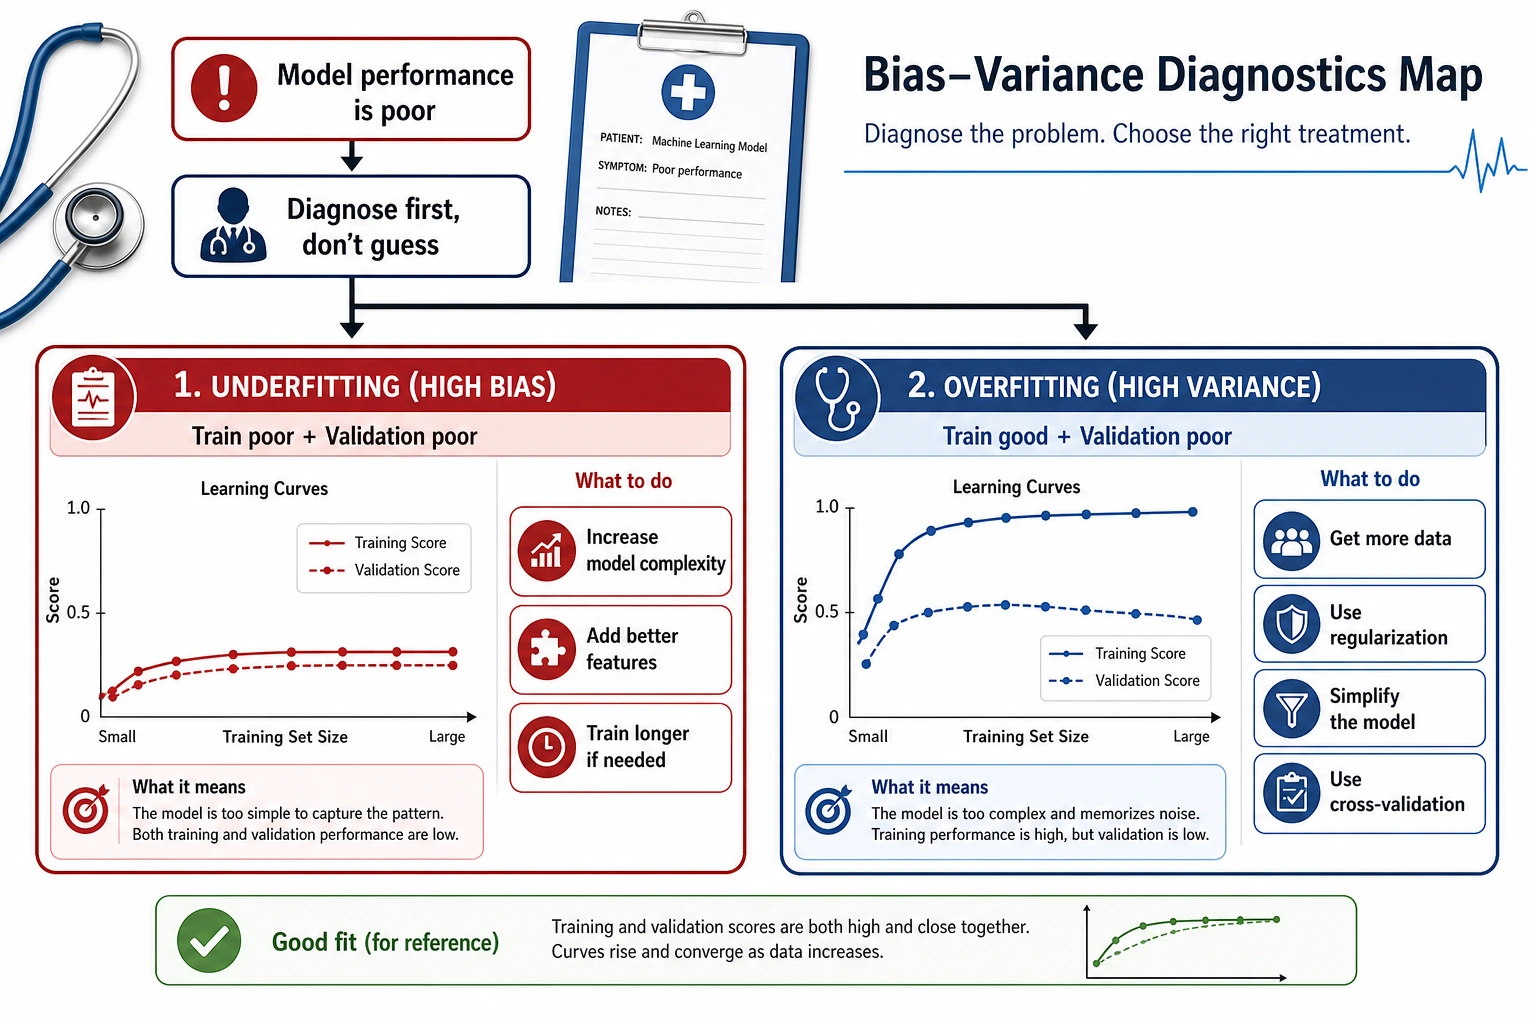
Diagnosis Rules
| Pattern | Likely problem | Try |
|---|---|---|
| train low, validation low | high bias / underfitting | richer model, better features, less regularization |
| train high, validation low | high variance / overfitting | simpler model, more regularization, more data |
| train high, validation high | good fit | test on final holdout and monitor drift |
| validation varies a lot by fold | instability or data segments | inspect folds, add data, use robust models |
Do not diagnose from one metric alone. Check train score, validation score, gap, and whether the mistakes are concentrated in a segment.
Practical Fixes
For high bias:
- add useful features;
- use a more expressive model;
- reduce overly strong regularization;
- train longer if the model is iterative.
For high variance:
- reduce model complexity;
- increase regularization;
- collect more diverse data;
- use cross-validation and a final holdout;
- consider ensembles that reduce variance.
Practical Debugging Checklist
| Symptom | Likely cause | Fix |
|---|---|---|
| Both train and validation are poor | model cannot express the pattern | improve features or model class |
| Train is perfect, validation is worse | overfitting | limit depth, prune, regularize |
| More data improves validation | variance or data scarcity | collect more representative data |
| More data does not help | high bias or noisy labels | improve features, labels, or model |
| Validation score jumps by fold | data is uneven | inspect segment distribution |
Practice
- Add
min_samples_leaf=5to the tree. How does the gap change? - Try
max_depth=2, 4, 6, 8. Where does test accuracy peak? - Replace the tree with logistic regression. Is the issue bias or variance?
- Use 5-fold cross-validation instead of one test split for the complexity lab.
- Inspect mistakes for the best tree. Are errors concentrated in one class?
Pass Check
You are done when you can explain:
- high bias means the model is too simple or missing signal;
- high variance means the model is too sensitive to training details;
- the train-validation gap is a practical diagnostic;
- learning curves show whether more data may help;
- the fix depends on the pattern, not the vocabulary.