
3.6.3 ハンズオンワークショップ:再現可能なデータ分析パイプラインを作る
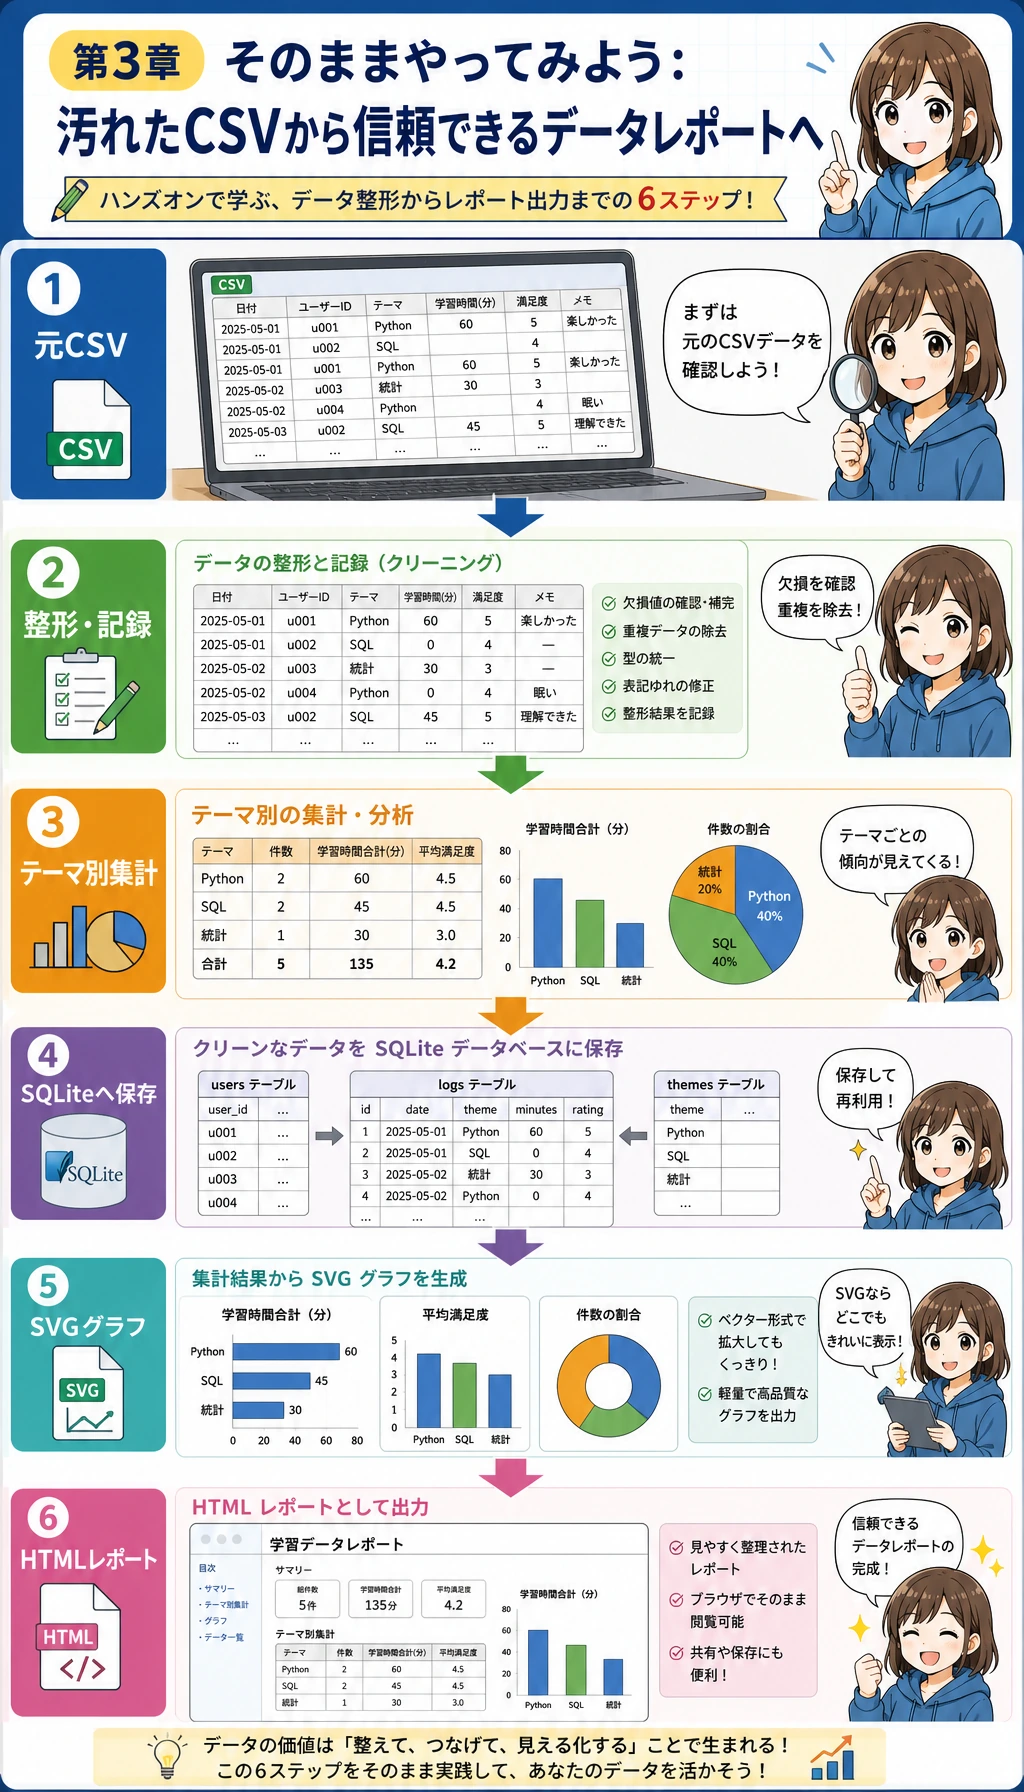
何を作るのか
Section titled “何を作るのか”小さな学習ログ分析パイプラインを作ります。外部パッケージは不要で、Python 標準ライブラリだけを使います。そのため、新しい環境でもまず動かしやすく、あとから同じ手順を Pandas、Matplotlib、Notebook に置き換えて発展できます。
完成すると、フォルダには次のファイルができます。
| ファイル | 意味 |
|---|---|
raw_learning_log.csv | わざと問題を含めた元データ |
clean_learning_log.csv | 分析に使うクリーニング済みテーブル |
cleaning_log.json | 削除した行と理由の記録 |
learning_log.sqlite3 | クリーニング済み行から作った SQLite データベース |
topic_minutes.svg | スクリプトで生成したグラフ |
report.html | ブラウザで開ける簡単な分析レポート |
ステップ 0:きれいな練習フォルダを作る
Section titled “ステップ 0:きれいな練習フォルダを作る”ターミナルで次のコマンドを実行してください。Windows の場合は PowerShell を使い、必要なら python3 を python に置き換えます。
mkdir ch03-learning-log-workshopcd ch03-learning-log-workshoppython3 --version出力は次のようになります。バージョン番号は違っていてかまいません。
Python 3.12.3このターミナルは開いたままにしておきます。以降のコマンドは ch03-learning-log-workshop の中で実行する前提です。
ステップ 1:コードを書く前にパイプラインを見る
Section titled “ステップ 1:コードを書く前にパイプラインを見る”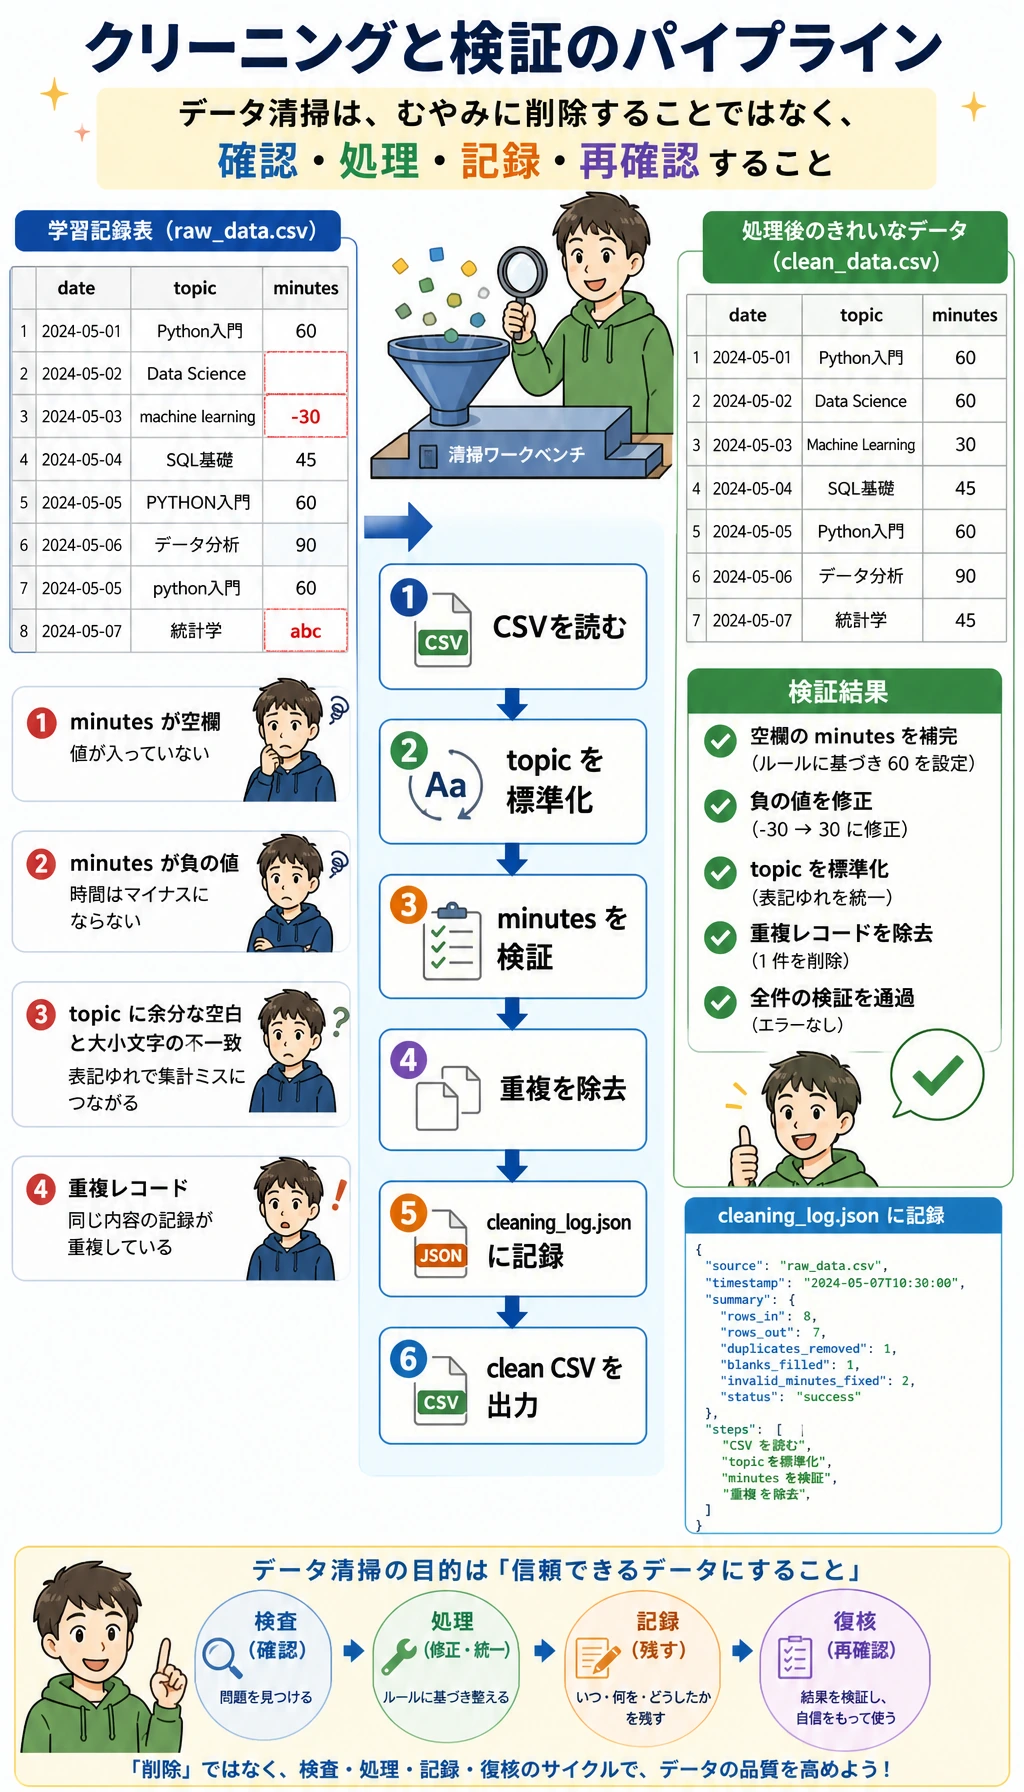
大事な考え方は単純です。元データからいきなり結論へ飛ばないこと。信頼できる分析は、すべての変換に証拠を残します。
| 段階 | 問うこと | 出力 |
|---|---|---|
| 入力を作る | 元データはどんな形か? | raw_learning_log.csv |
| クリーニング | 無効な行や重複行はどれか? | clean_learning_log.csv、cleaning_log.json |
| 集計 | どのトピックに一番時間を使ったか? | トピック別の集計結果 |
| クエリ | 同じきれいなデータをデータベースのように問い合わせられるか? | learning_log.sqlite3 |
| 可視化 | ひと目で見せたい結果は何か? | topic_minutes.svg |
| レポート | 他の人は何を信じ、何を確認できるか? | report.html |
ステップ 2:実行できるスクリプトを作る
Section titled “ステップ 2:実行できるスクリプトを作る”learning_log_pipeline.py というファイルを作り、次の完全なスクリプトを貼り付けます。
from __future__ import annotations
import csvimport htmlimport jsonimport sqlite3from collections import defaultdictfrom pathlib import Pathfrom statistics import mean
OUTPUT_DIR = Path("ch03_output")RAW_CSV = OUTPUT_DIR / "raw_learning_log.csv"CLEAN_CSV = OUTPUT_DIR / "clean_learning_log.csv"DATABASE = OUTPUT_DIR / "learning_log.sqlite3"CHART_SVG = OUTPUT_DIR / "topic_minutes.svg"REPORT_HTML = OUTPUT_DIR / "report.html"CLEANING_LOG = OUTPUT_DIR / "cleaning_log.json"
FIELDNAMES = ["date", "topic", "minutes", "status", "confidence", "note"]
RAW_ROWS = [    {"date": "2026-05-01", "topic": "Python", "minutes": "45", "status": "completed", "confidence": "0.92", "note": "loops and conditions"},    {"date": "2026-05-01", "topic": " pandas ", "minutes": "30", "status": "stuck", "confidence": "0.55", "note": "merge confusion"},    {"date": "2026-05-02", "topic": "Python", "minutes": "60", "status": "completed", "confidence": "0.88", "note": "functions"},    {"date": "2026-05-02", "topic": "SQL", "minutes": "35", "status": "completed", "confidence": "0.81", "note": "select and where"},    {"date": "2026-05-03", "topic": "Pandas", "minutes": "", "status": "stuck", "confidence": "0.40", "note": "forgot to track time"},    {"date": "2026-05-03", "topic": "Visualization", "minutes": "50", "status": "completed", "confidence": "0.76", "note": "bar chart"},    {"date": "2026-05-04", "topic": "sql", "minutes": "-10", "status": "completed", "confidence": "0.70", "note": "timer entered backwards"},    {"date": "2026-05-04", "topic": "Pandas", "minutes": "40", "status": "completed", "confidence": "0.66", "note": "groupby practice"},    {"date": "2026-05-05", "topic": "Python", "minutes": "45", "status": "completed", "confidence": "0.82", "note": "list comprehension"},    {"date": "2026-05-05", "topic": "Python", "minutes": "45", "status": "completed", "confidence": "0.82", "note": "list comprehension"},    {"date": "2026-05-05", "topic": "RAG", "minutes": "25", "status": "stuck", "confidence": "0.50", "note": "chunking terms"},    {"date": "2026-05-06", "topic": "Visualization", "minutes": "65", "status": "completed", "confidence": "0.91", "note": "line chart"},]

def normalize_topic(value: str) -> str:    aliases = {        "python": "Python",        "pandas": "Pandas",        "sql": "SQL",        "visualization": "Visualization",        "rag": "RAG",    }    cleaned = value.strip().lower()    return aliases.get(cleaned, cleaned.title())

def parse_positive_minutes(value: str) -> int | None:    try:        minutes = int(value)    except (TypeError, ValueError):        return None    if minutes <= 0:        return None    return minutes

def parse_confidence(value: str) -> float:    try:        confidence = float(value)    except (TypeError, ValueError):        return 0.0    return max(0.0, min(confidence, 1.0))

def write_raw_csv() -> None:    OUTPUT_DIR.mkdir(exist_ok=True)    with RAW_CSV.open("w", encoding="utf-8", newline="") as file:        writer = csv.DictWriter(file, fieldnames=FIELDNAMES)        writer.writeheader()        writer.writerows(RAW_ROWS)

def load_and_clean(path: Path) -> tuple[list[dict[str, object]], list[dict[str, object]]]:    clean_rows: list[dict[str, object]] = []    cleaning_log: list[dict[str, object]] = []    seen: set[tuple[object, ...]] = set()
    with path.open(encoding="utf-8", newline="") as file:        reader = csv.DictReader(file)        for line_number, row in enumerate(reader, start=2):            topic = normalize_topic(row["topic"])            status = row["status"].strip().lower()            minutes = parse_positive_minutes(row["minutes"])            confidence = parse_confidence(row["confidence"])            note = row["note"].strip()
            if minutes is None:                cleaning_log.append({"line": line_number, "action": "drop", "reason": "minutes is missing, non-numeric, or <= 0", "row": row})                continue
            key = (row["date"].strip(), topic, minutes, status, note)            if key in seen:                cleaning_log.append({"line": line_number, "action": "drop", "reason": "duplicate learning record", "row": row})                continue            seen.add(key)
            clean_rows.append(                {                    "date": row["date"].strip(),                    "topic": topic,                    "minutes": minutes,                    "status": status,                    "confidence": confidence,                    "note": note,                }            )
    return clean_rows, cleaning_log

def write_clean_csv(rows: list[dict[str, object]]) -> None:    with CLEAN_CSV.open("w", encoding="utf-8", newline="") as file:        writer = csv.DictWriter(file, fieldnames=FIELDNAMES)        writer.writeheader()        writer.writerows(rows)

def summarize_by_topic(rows: list[dict[str, object]]) -> list[dict[str, object]]:    buckets: dict[str, dict[str, object]] = defaultdict(lambda: {"minutes": 0, "sessions": 0, "completed": 0, "confidence_values": []})    for row in rows:        topic = str(row["topic"])        buckets[topic]["minutes"] = int(buckets[topic]["minutes"]) + int(row["minutes"])        buckets[topic]["sessions"] = int(buckets[topic]["sessions"]) + 1        buckets[topic]["completed"] = int(buckets[topic]["completed"]) + (1 if row["status"] == "completed" else 0)        buckets[topic]["confidence_values"].append(float(row["confidence"]))
    summary = []    for topic, values in buckets.items():        sessions = int(values["sessions"])        completed = int(values["completed"])        confidence_values = values["confidence_values"]        summary.append(            {                "topic": topic,                "minutes": int(values["minutes"]),                "sessions": sessions,                "completion_rate": round(completed / sessions * 100, 1),                "avg_confidence": round(mean(confidence_values), 2),            }        )    return sorted(summary, key=lambda item: (-int(item["minutes"]), str(item["topic"])))

def write_cleaning_log(cleaning_log: list[dict[str, object]]) -> None:    CLEANING_LOG.write_text(json.dumps(cleaning_log, ensure_ascii=False, indent=2), encoding="utf-8")

def write_sqlite(rows: list[dict[str, object]]) -> None:    with sqlite3.connect(DATABASE) as conn:        conn.execute("DROP TABLE IF EXISTS learning_logs")        conn.execute(            """            CREATE TABLE learning_logs (                date TEXT NOT NULL,                topic TEXT NOT NULL,                minutes INTEGER NOT NULL,                status TEXT NOT NULL,                confidence REAL NOT NULL,                note TEXT NOT NULL            )            """        )        conn.executemany(            """            INSERT INTO learning_logs (date, topic, minutes, status, confidence, note)            VALUES (:date, :topic, :minutes, :status, :confidence, :note)            """,            rows,        )

def query_sqlite_top_topics() -> list[tuple[str, int, float]]:    with sqlite3.connect(DATABASE) as conn:        return conn.execute(            """            SELECT topic, SUM(minutes) AS total_minutes, ROUND(AVG(confidence), 2) AS avg_confidence            FROM learning_logs            GROUP BY topic            ORDER BY total_minutes DESC            LIMIT 3            """        ).fetchall()

def write_svg_bar_chart(summary: list[dict[str, object]]) -> None:    max_minutes = max(int(item["minutes"]) for item in summary)    width = 860    height = 120 + len(summary) * 74    left = 180    bar_max_width = 540    colors = ["#2563eb", "#0f766e", "#dc2626", "#7c3aed", "#ea580c"]    lines = [        f'<svg xmlns="http://www.w3.org/2000/svg" width="{width}" height="{height}" viewBox="0 0 {width} {height}">',        '<rect width="100%" height="100%" fill="#f8fafc"/>',        '<text x="32" y="48" font-family="Arial, sans-serif" font-size="26" font-weight="700" fill="#0f172a">トピック別の学習分数</text>',        '<text x="32" y="78" font-family="Arial, sans-serif" font-size="15" fill="#475569">クレンジング済み学習ログをトピック別に集計</text>',    ]    for index, item in enumerate(summary):        y = 112 + index * 74        topic = html.escape(str(item["topic"]))        minutes = int(item["minutes"])        bar_width = int(minutes / max_minutes * bar_max_width)        color = colors[index % len(colors)]        lines.extend(            [                f'<text x="32" y="{y + 27}" font-family="Arial, sans-serif" font-size="18" fill="#0f172a">{topic}</text>',                f'<rect x="{left}" y="{y}" width="{bar_max_width}" height="34" rx="8" fill="#e2e8f0"/>',                f'<rect x="{left}" y="{y}" width="{bar_width}" height="34" rx="8" fill="{color}"/>',                f'<text x="{left + bar_max_width + 20}" y="{y + 24}" font-family="Arial, sans-serif" font-size="17" fill="#0f172a">{minutes} min</text>',            ]        )    lines.append("</svg>")    CHART_SVG.write_text("\n".join(lines), encoding="utf-8")

def write_report(summary: list[dict[str, object]], sql_rows: list[tuple[str, int, float]], cleaning_log: list[dict[str, object]]) -> None:    total_minutes = sum(int(item["minutes"]) for item in summary)    rows_html = "\n".join(        f"<tr><td>{html.escape(str(item['topic']))}</td><td>{item['minutes']}</td><td>{item['sessions']}</td><td>{item['completion_rate']}%</td><td>{item['avg_confidence']}</td></tr>"        for item in summary    )    sql_html = "\n".join(        f"<li><strong>{html.escape(topic)}</strong>:{minutes} 分、平均信頼度 {confidence}</li>"        for topic, minutes, confidence in sql_rows    )    REPORT_HTML.write_text(        f"""<!doctype html><html lang="ja"><head>  <meta charset="utf-8" />  <title>学習ログ分析レポート</title>  <style>    body {{ font-family: Arial, sans-serif; max-width: 960px; margin: 32px auto; color: #0f172a; line-height: 1.6; }}    .cards {{ display: grid; grid-template-columns: repeat(3, 1fr); gap: 12px; }}    .card {{ background: #eef2ff; border-radius: 12px; padding: 16px; }}    table {{ width: 100%; border-collapse: collapse; margin-top: 16px; }}    th, td {{ border-bottom: 1px solid #cbd5e1; text-align: left; padding: 10px; }}    img {{ max-width: 100%; border: 1px solid #e2e8f0; border-radius: 12px; }}  </style></head><body>  <h1>学習ログ分析レポート</h1>  <p>このレポートは、汚い CSV をクレンジングし、集計し、SQLite で問い合わせ、可視化して生成したものです。</p>  <section class="cards">    <div class="card"><strong>合計分数</strong><br>{total_minutes}</div>    <div class="card"><strong>クレンジング後のトピック数</strong><br>{len(summary)}</div>    <div class="card"><strong>除外行数</strong><br>{len(cleaning_log)}</div>  </section>  <h2>グラフ</h2>  <img src="topic_minutes.svg" alt="トピック別の学習分数" />  <h2>トピック集計</h2>  <table>    <tr><th>トピック</th><th>分数</th><th>セッション数</th><th>完了率</th><th>平均信頼度</th></tr>    {rows_html}  </table>  <h2>SQLite 上位トピック</h2>  <ul>{sql_html}</ul>  <h2>結論</h2>  <p>Python の合計学習時間が最も多いです。Visualization も強い一方、Pandas は信頼度が低めなので、次の練習では Pandas のグループ化と結合に集中します。</p></body></html>""".strip(),        encoding="utf-8",    )

def main() -> None:    write_raw_csv()    clean_rows, cleaning_log = load_and_clean(RAW_CSV)    summary = summarize_by_topic(clean_rows)    write_clean_csv(clean_rows)    write_cleaning_log(cleaning_log)    write_sqlite(clean_rows)    sql_rows = query_sqlite_top_topics()    write_svg_bar_chart(summary)    write_report(summary, sql_rows, cleaning_log)
    total_minutes = sum(int(row["minutes"]) for row in clean_rows)    completed_rows = sum(1 for row in clean_rows if row["status"] == "completed")    completion_rate = completed_rows / len(clean_rows) * 100    top_topic = summary[0]
    print(f"生データ行数: {len(RAW_ROWS)}")    print(f"クレンジング後の行数: {len(clean_rows)}")    print(f"除外行数: {len(cleaning_log)}")    print(f"合計学習分数: {total_minutes}")    print(f"完了率: {completion_rate:.1f}%")    print(f"最上位トピック: {top_topic['topic']} ({top_topic['minutes']} 分)")    print("\nSQLite の上位 3 トピック:")    for topic, minutes, confidence in sql_rows:        print(f"- {topic}: {minutes} 分、平均信頼度 {confidence}")    print("\n生成ファイル:")    for path in [RAW_CSV, CLEAN_CSV, CLEANING_LOG, DATABASE, CHART_SVG, REPORT_HTML]:        print(f"- {path.as_posix()}")

if __name__ == "__main__":    main()
ステップ 3:実行して出力を比べる
Section titled “ステップ 3:実行して出力を比べる”python3 learning_log_pipeline.py期待される出力:
生データ行数: 12クレンジング後の行数: 9除外行数: 3合計学習分数: 395完了率: 77.8%最上位トピック: Python (150 分)
SQLite の上位 3 トピック:- Python: 150 分、平均信頼度 0.87- Visualization: 115 分、平均信頼度 0.83- Pandas: 70 分、平均信頼度 0.6
生成ファイル:- ch03_output/raw_learning_log.csv- ch03_output/clean_learning_log.csv- ch03_output/cleaning_log.json- ch03_output/learning_log.sqlite3- ch03_output/topic_minutes.svg- ch03_output/report.html
行数と集計値が一致していれば、パイプラインは正しく動いています。
ステップ 4:生成された証拠を読む
Section titled “ステップ 4:生成された証拠を読む”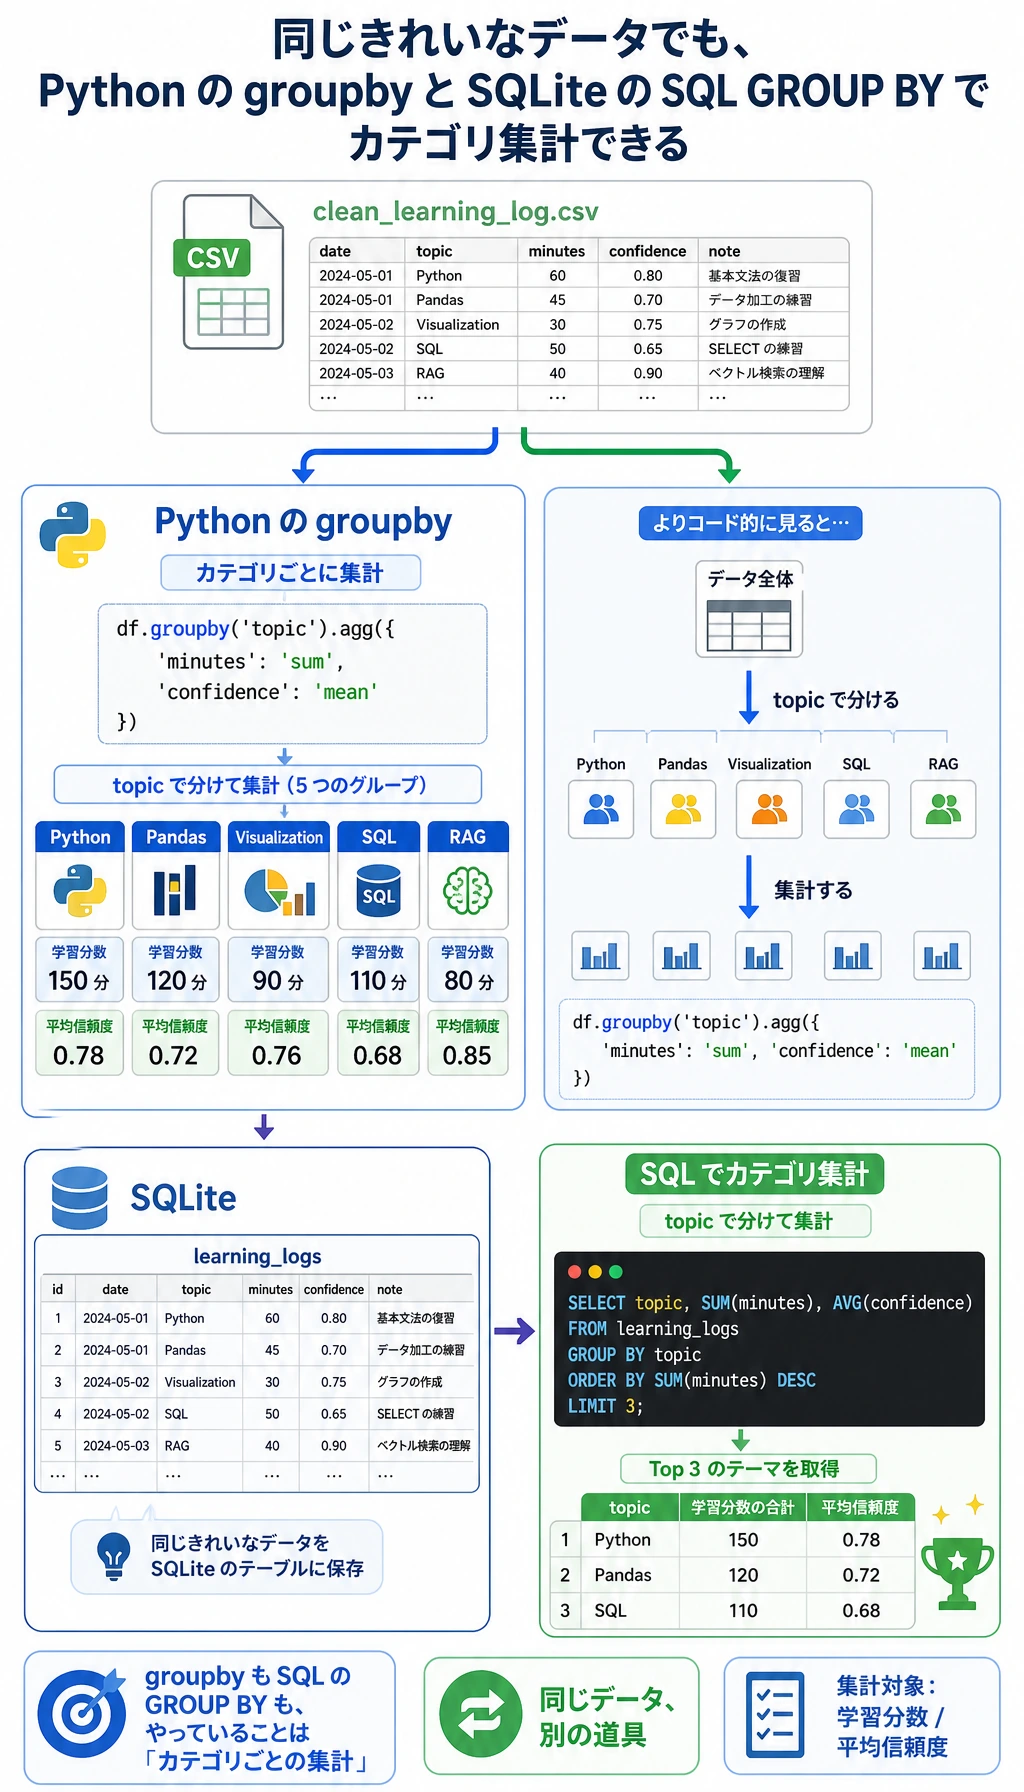
まず ch03_output/cleaning_log.json を開きます。削除された 3 行が記録されているはずです。1 行は minutes が空、1 行は minutes が負数、もう 1 行は重複レコードです。このファイルは重要です。記録のないデータクリーニングは、あとで信頼しにくくなります。
次に、クリーニング済み CSV を確認します。
python3 - <<'PY'import csv
with open("ch03_output/clean_learning_log.csv", encoding="utf-8", newline="") as file:    rows = list(csv.DictReader(file))
print(rows[0])print("rows:", len(rows))PY
期待される出力:
{'date': '2026-05-01', 'topic': 'Python', 'minutes': '45', 'status': 'completed', 'confidence': '0.92', 'note': 'loops and conditions'}rows: 9次に SQLite データベースを直接問い合わせます。
python3 - <<'PY'import sqlite3
with sqlite3.connect("ch03_output/learning_log.sqlite3") as conn:    for row in conn.execute("SELECT topic, SUM(minutes) FROM learning_logs GROUP BY topic ORDER BY SUM(minutes) DESC"):        print(row)PY
期待される出力:
('Python', 150)('Visualization', 115)('Pandas', 70)('SQL', 35)('RAG', 25)ステップ 5:グラフとレポートを開く
Section titled “ステップ 5:グラフとレポートを開く”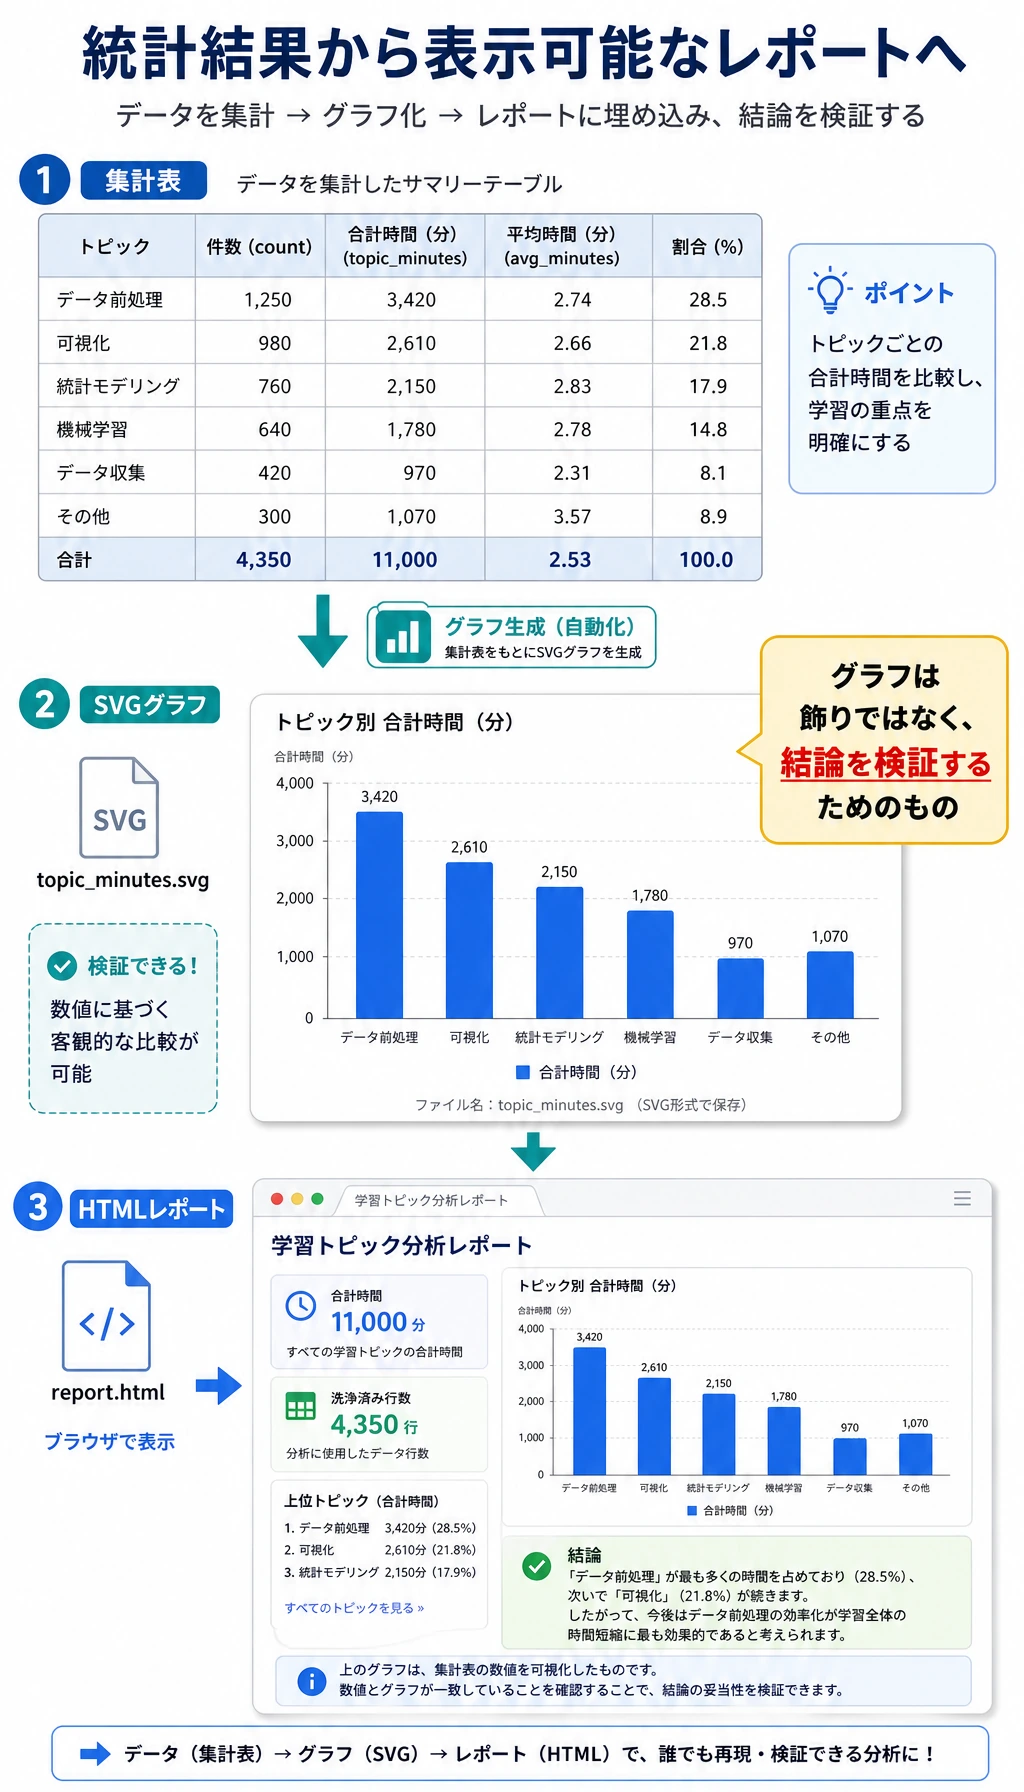
HTML レポートを開きます。
# macOSopen ch03_output/report.html
# Windows PowerShellstart ch03_output/report.html
# Linuxxdg-open ch03_output/report.html
このレポートはあえてシンプルにしています。見た目の豪華さよりも、すべての数字がクリーニング済み行に戻って確認でき、すべての結論を検証できることが目的です。
これらの概念が大事な理由
Section titled “これらの概念が大事な理由”| 用語 | 初心者向けの説明 |
|---|---|
CSV | プレーンテキストの表ファイル。見やすい一方で、データ品質は自動では保証されません。 |
cleaning log | クリーニングで何を変えたか、なぜ変えたかを記録するもの。結論のブラックボックス化を防ぎます。 |
grouped statistics | 行をカテゴリで分け、各グループの指標を計算して比較すること。 |
SQLite | Python の sqlite3 から使える、小さなファイル型リレーショナルデータベース。 |
SVG | テキスト形式の画像フォーマット。ここでは描画ライブラリなしでグラフを作っています。 |
| 再現性 | 別の人が同じスクリプトを実行しても、同じファイルと数字を得られること。 |
このページを終えたら、この evidence card を残します。
- 分析目標
- ビジネス/データの質問と成功基準
- データの証拠
- 取得元、クレンジングメモ、特徴量、図表の出力
- 結果
- 洞察、metric、dashboard、または report のセクション
- 失敗確認
- 汚れたデータ、偏ったサンプル、誤った集計、または再現不能な Notebook
- 期待される成果
- データ、図表、短いレポートを含む再現可能な分析フォルダ
よくあるエラーと直し方
Section titled “よくあるエラーと直し方”| 問題 | よくある原因 | 修正 |
|---|---|---|
python3: command not found | 環境では python を使う設定になっている | python --version を確認し、python learning_log_pipeline.py を実行する |
| 出力の行数が違う | スクリプトを途中で変更してしまった | もう一度コピーし、きれいなフォルダで再実行する |
report.html は開くがグラフが出ない | HTML を topic_minutes.svg と別の場所へ移動した | 両方を ch03_output/ の中に置く |
| SQLite クエリが古いデータを返す | 別のスクリプトが古い DB を使っている | このスクリプトは表を削除して再作成するので、最初から実行し直す |
| API は呼べるが結論を説明できない | メソッドだけ見て、証拠を見ていない | cleaning_log.json、clean_learning_log.csv、report.html の順に読む |
Machine Learningの行を追加し、minutesを0より大きくして再実行し、グラフの変化を確認する。confidenceが1.2の行を追加し、parse_confidence()が1.0に丸めることを確認する。- SQLite クエリを変更し、
status = 'stuck'の行だけを表示する。 difficultyというフィールドを追加し、CSV、SQLite テーブル、レポートに反映する。- Pandas の章を終えたら、
summarize_by_topic()を Pandas で書き直し、この標準ライブラリ版と結果を比較する。
操作例と確認ポイント
- 表編集のミニ演習では、変更後の CSV または SQLite テーブルと、その変更を証明する正確なクエリまたは Pandas 文を証拠として残します。
- confidence 値が有効範囲を超える可能性があるなら、clip または検証し、そのルールを記録します。隠れた不正値は、見える警告より危険です。
- difficulty のような新しいフィールドを追加するときは、CSV、データベース schema、読み込みコード、レポート出力を一緒に更新し、データ経路を端から端まで一貫させます。
ポートフォリオ用の証拠チェックリスト
Section titled “ポートフォリオ用の証拠チェックリスト”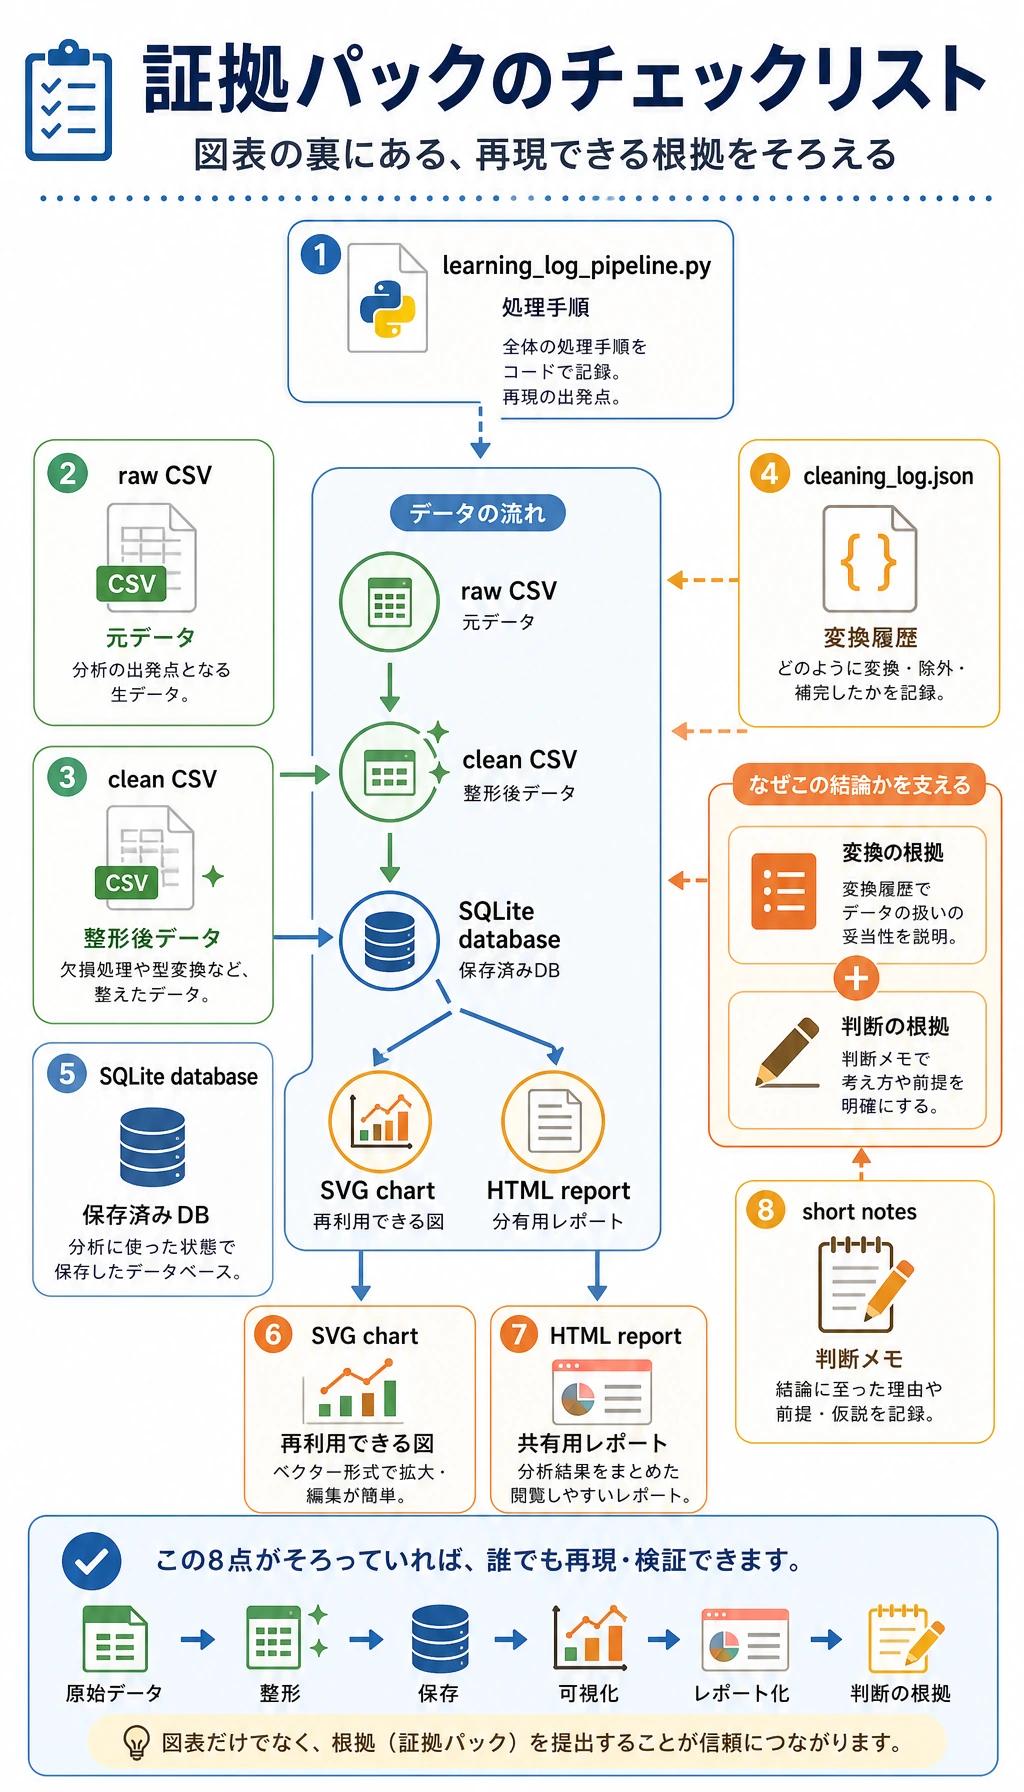
このワークショップをポートフォリオ練習に使う場合は、次の材料を残しておきます。
- スクリプト:
learning_log_pipeline.py - 元データ:
raw_learning_log.csv - クリーニング後データ:
clean_learning_log.csv - クリーニング記録:
cleaning_log.json - データベース:
learning_log.sqlite3 - グラフ:
topic_minutes.svg - レポート:
report.html - 何を削除したか、どのトピックが 1 位だったか、次に何を分析したいかを書いた短いメモ
これはデータ作業の最低限のプロ習慣です。最後のグラフだけでなく、そのグラフを信頼できるものにした道筋も見せましょう。