
3.6.3 跟做工作坊:搭建可复现的数据分析流水线
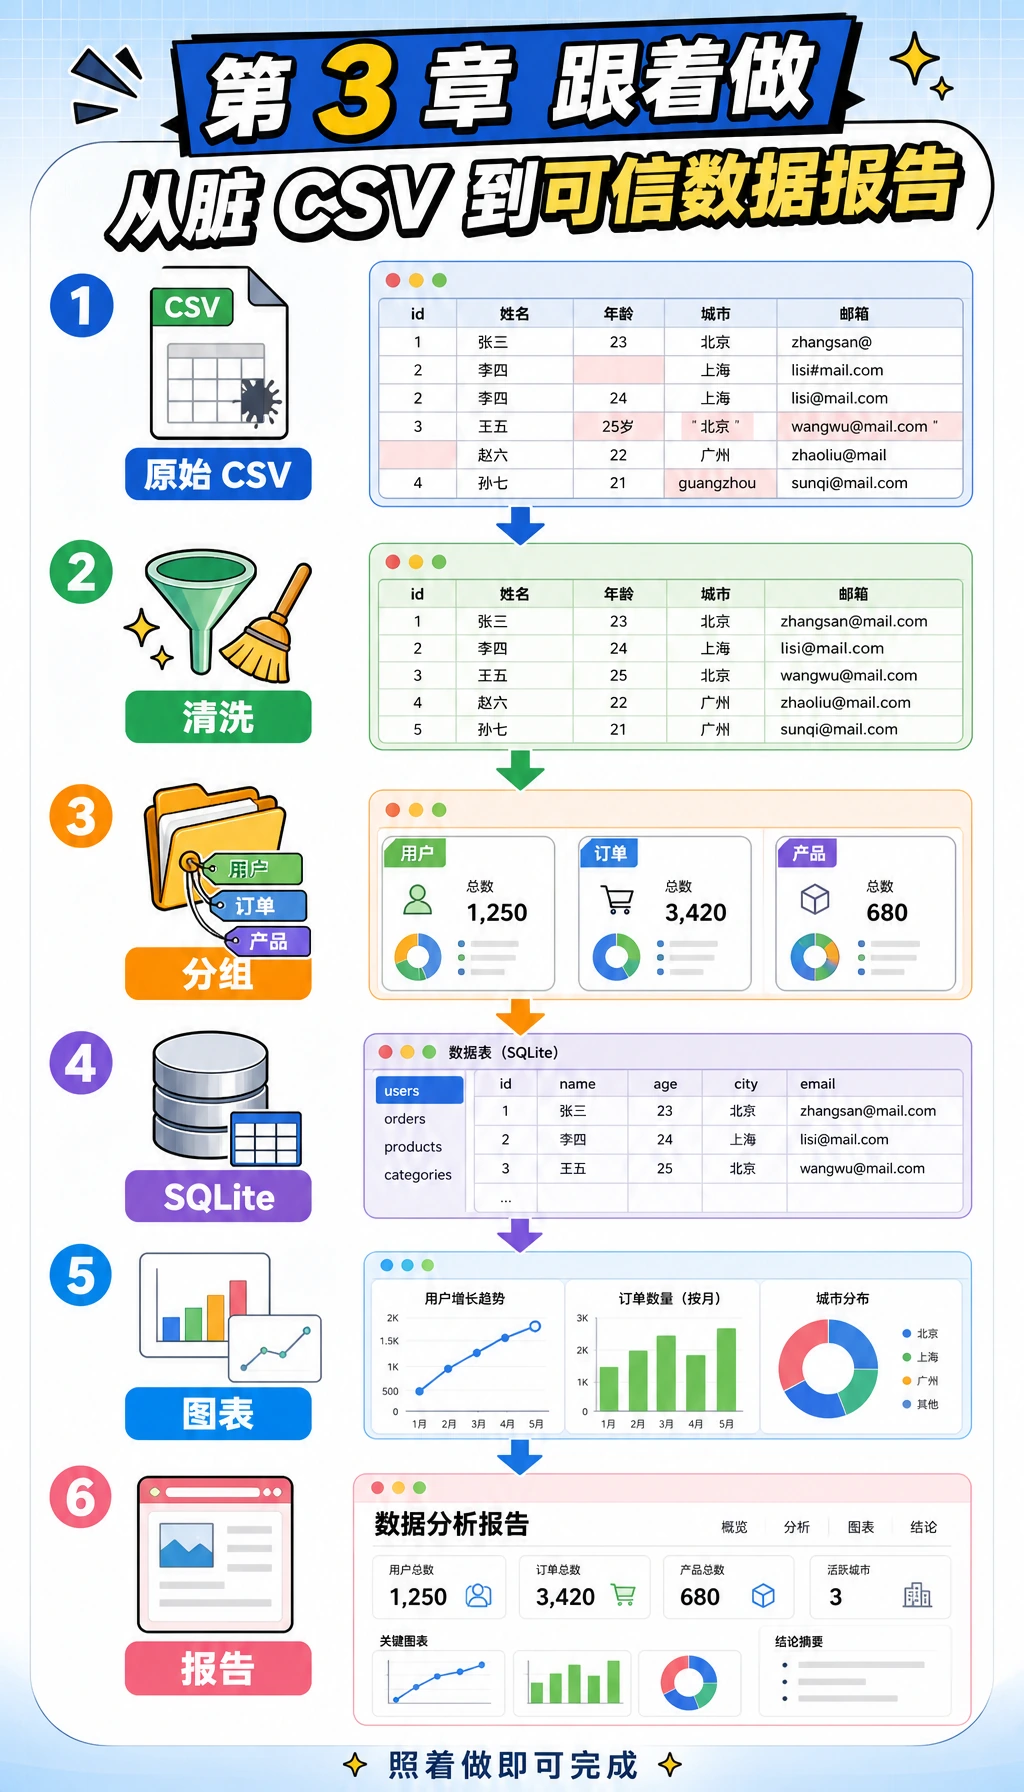
你会做出什么
Section titled “你会做出什么”我们会搭建一个小型学习记录分析流水线。它不依赖外部包,只使用 Python 标准库,所以新电脑上也更容易先跑起来。等你学完 Pandas、Matplotlib 或 Notebook 后,可以把同一套步骤升级成更专业的版本。
完成后,你的文件夹里会有这些文件:
| 文件 | 含义 |
|---|---|
raw_learning_log.csv | 故意做脏的原始输入数据 |
clean_learning_log.csv | 用于分析的清洗后表格 |
cleaning_log.json | 每一条被丢弃记录及原因 |
learning_log.sqlite3 | 由清洗数据写入的 SQLite 数据库 |
topic_minutes.svg | 脚本生成的图表 |
report.html | 可以用浏览器打开的简易分析报告 |
步骤 0:创建干净的练习文件夹
Section titled “步骤 0:创建干净的练习文件夹”在终端运行下面的命令。如果你使用 Windows,可以在 PowerShell 里执行;如果 python3 不存在,就把它换成 python。
mkdir ch03-learning-log-workshopcd ch03-learning-log-workshoppython3 --version预期输出类似下面这样,版本号不同没关系。
Python 3.12.3保持这个终端打开。后面的命令默认都在 ch03-learning-log-workshop 目录里执行。
步骤 1:先看懂流水线,再写代码
Section titled “步骤 1:先看懂流水线,再写代码”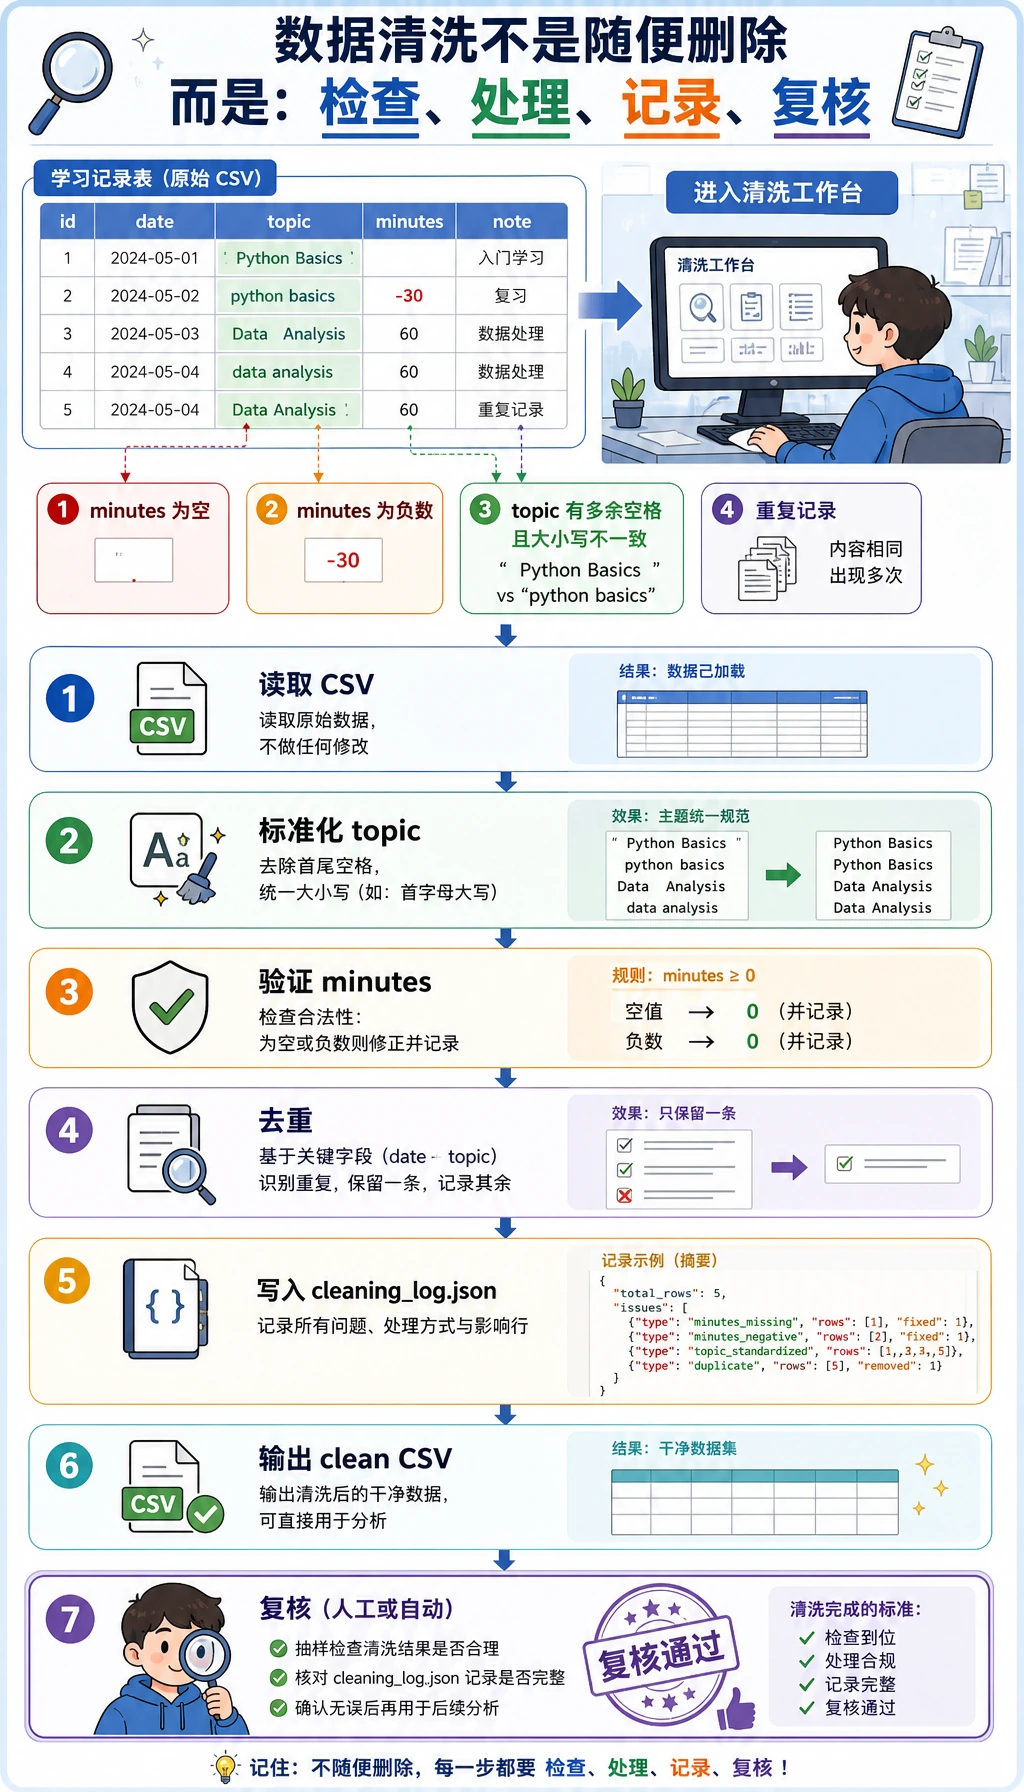
核心思路很简单:不要从原始数据直接跳到结论。可信的数据分析应该为每一次转换留下证据。
| 阶段 | 要问的问题 | 输出 |
|---|---|---|
| 生成输入 | 原始数据长什么样? | raw_learning_log.csv |
| 清洗 | 哪些行无效或重复? | clean_learning_log.csv、cleaning_log.json |
| 汇总 | 哪个主题投入时间最多? | 按主题分组后的统计结果 |
| 查询 | 同一份干净数据能否像数据库一样查询? | learning_log.sqlite3 |
| 可视化 | 哪个结果需要一眼看懂? | topic_minutes.svg |
| 报告 | 别人应该相信什么,又能检查什么? | report.html |
步骤 2:创建可运行脚本
Section titled “步骤 2:创建可运行脚本”创建一个名为 learning_log_pipeline.py 的文件,然后粘贴下面完整脚本。
from __future__ import annotations
import csvimport htmlimport jsonimport sqlite3from collections import defaultdictfrom pathlib import Pathfrom statistics import mean
OUTPUT_DIR = Path("ch03_output")RAW_CSV = OUTPUT_DIR / "raw_learning_log.csv"CLEAN_CSV = OUTPUT_DIR / "clean_learning_log.csv"DATABASE = OUTPUT_DIR / "learning_log.sqlite3"CHART_SVG = OUTPUT_DIR / "topic_minutes.svg"REPORT_HTML = OUTPUT_DIR / "report.html"CLEANING_LOG = OUTPUT_DIR / "cleaning_log.json"
FIELDNAMES = ["date", "topic", "minutes", "status", "confidence", "note"]
RAW_ROWS = [    {"date": "2026-05-01", "topic": "Python", "minutes": "45", "status": "completed", "confidence": "0.92", "note": "loops and conditions"},    {"date": "2026-05-01", "topic": " pandas ", "minutes": "30", "status": "stuck", "confidence": "0.55", "note": "merge confusion"},    {"date": "2026-05-02", "topic": "Python", "minutes": "60", "status": "completed", "confidence": "0.88", "note": "functions"},    {"date": "2026-05-02", "topic": "SQL", "minutes": "35", "status": "completed", "confidence": "0.81", "note": "select and where"},    {"date": "2026-05-03", "topic": "Pandas", "minutes": "", "status": "stuck", "confidence": "0.40", "note": "forgot to track time"},    {"date": "2026-05-03", "topic": "Visualization", "minutes": "50", "status": "completed", "confidence": "0.76", "note": "bar chart"},    {"date": "2026-05-04", "topic": "sql", "minutes": "-10", "status": "completed", "confidence": "0.70", "note": "timer entered backwards"},    {"date": "2026-05-04", "topic": "Pandas", "minutes": "40", "status": "completed", "confidence": "0.66", "note": "groupby practice"},    {"date": "2026-05-05", "topic": "Python", "minutes": "45", "status": "completed", "confidence": "0.82", "note": "list comprehension"},    {"date": "2026-05-05", "topic": "Python", "minutes": "45", "status": "completed", "confidence": "0.82", "note": "list comprehension"},    {"date": "2026-05-05", "topic": "RAG", "minutes": "25", "status": "stuck", "confidence": "0.50", "note": "chunking terms"},    {"date": "2026-05-06", "topic": "Visualization", "minutes": "65", "status": "completed", "confidence": "0.91", "note": "line chart"},]

def normalize_topic(value: str) -> str:    aliases = {        "python": "Python",        "pandas": "Pandas",        "sql": "SQL",        "visualization": "Visualization",        "rag": "RAG",    }    cleaned = value.strip().lower()    return aliases.get(cleaned, cleaned.title())

def parse_positive_minutes(value: str) -> int | None:    try:        minutes = int(value)    except (TypeError, ValueError):        return None    if minutes <= 0:        return None    return minutes

def parse_confidence(value: str) -> float:    try:        confidence = float(value)    except (TypeError, ValueError):        return 0.0    return max(0.0, min(confidence, 1.0))

def write_raw_csv() -> None:    OUTPUT_DIR.mkdir(exist_ok=True)    with RAW_CSV.open("w", encoding="utf-8", newline="") as file:        writer = csv.DictWriter(file, fieldnames=FIELDNAMES)        writer.writeheader()        writer.writerows(RAW_ROWS)

def load_and_clean(path: Path) -> tuple[list[dict[str, object]], list[dict[str, object]]]:    clean_rows: list[dict[str, object]] = []    cleaning_log: list[dict[str, object]] = []    seen: set[tuple[object, ...]] = set()
    with path.open(encoding="utf-8", newline="") as file:        reader = csv.DictReader(file)        for line_number, row in enumerate(reader, start=2):            topic = normalize_topic(row["topic"])            status = row["status"].strip().lower()            minutes = parse_positive_minutes(row["minutes"])            confidence = parse_confidence(row["confidence"])            note = row["note"].strip()
            if minutes is None:                cleaning_log.append({"line": line_number, "action": "drop", "reason": "minutes is missing, non-numeric, or <= 0", "row": row})                continue
            key = (row["date"].strip(), topic, minutes, status, note)            if key in seen:                cleaning_log.append({"line": line_number, "action": "drop", "reason": "duplicate learning record", "row": row})                continue            seen.add(key)
            clean_rows.append(                {                    "date": row["date"].strip(),                    "topic": topic,                    "minutes": minutes,                    "status": status,                    "confidence": confidence,                    "note": note,                }            )
    return clean_rows, cleaning_log

def write_clean_csv(rows: list[dict[str, object]]) -> None:    with CLEAN_CSV.open("w", encoding="utf-8", newline="") as file:        writer = csv.DictWriter(file, fieldnames=FIELDNAMES)        writer.writeheader()        writer.writerows(rows)

def summarize_by_topic(rows: list[dict[str, object]]) -> list[dict[str, object]]:    buckets: dict[str, dict[str, object]] = defaultdict(lambda: {"minutes": 0, "sessions": 0, "completed": 0, "confidence_values": []})    for row in rows:        topic = str(row["topic"])        buckets[topic]["minutes"] = int(buckets[topic]["minutes"]) + int(row["minutes"])        buckets[topic]["sessions"] = int(buckets[topic]["sessions"]) + 1        buckets[topic]["completed"] = int(buckets[topic]["completed"]) + (1 if row["status"] == "completed" else 0)        buckets[topic]["confidence_values"].append(float(row["confidence"]))
    summary = []    for topic, values in buckets.items():        sessions = int(values["sessions"])        completed = int(values["completed"])        confidence_values = values["confidence_values"]        summary.append(            {                "topic": topic,                "minutes": int(values["minutes"]),                "sessions": sessions,                "completion_rate": round(completed / sessions * 100, 1),                "avg_confidence": round(mean(confidence_values), 2),            }        )    return sorted(summary, key=lambda item: (-int(item["minutes"]), str(item["topic"])))

def write_cleaning_log(cleaning_log: list[dict[str, object]]) -> None:    CLEANING_LOG.write_text(json.dumps(cleaning_log, ensure_ascii=False, indent=2), encoding="utf-8")

def write_sqlite(rows: list[dict[str, object]]) -> None:    with sqlite3.connect(DATABASE) as conn:        conn.execute("DROP TABLE IF EXISTS learning_logs")        conn.execute(            """            CREATE TABLE learning_logs (                date TEXT NOT NULL,                topic TEXT NOT NULL,                minutes INTEGER NOT NULL,                status TEXT NOT NULL,                confidence REAL NOT NULL,                note TEXT NOT NULL            )            """        )        conn.executemany(            """            INSERT INTO learning_logs (date, topic, minutes, status, confidence, note)            VALUES (:date, :topic, :minutes, :status, :confidence, :note)            """,            rows,        )

def query_sqlite_top_topics() -> list[tuple[str, int, float]]:    with sqlite3.connect(DATABASE) as conn:        return conn.execute(            """            SELECT topic, SUM(minutes) AS total_minutes, ROUND(AVG(confidence), 2) AS avg_confidence            FROM learning_logs            GROUP BY topic            ORDER BY total_minutes DESC            LIMIT 3            """        ).fetchall()

def write_svg_bar_chart(summary: list[dict[str, object]]) -> None:    max_minutes = max(int(item["minutes"]) for item in summary)    width = 860    height = 120 + len(summary) * 74    left = 180    bar_max_width = 540    colors = ["#2563eb", "#0f766e", "#dc2626", "#7c3aed", "#ea580c"]    lines = [        f'<svg xmlns="http://www.w3.org/2000/svg" width="{width}" height="{height}" viewBox="0 0 {width} {height}">',        '<rect width="100%" height="100%" fill="#f8fafc"/>',        '<text x="32" y="48" font-family="Arial, sans-serif" font-size="26" font-weight="700" fill="#0f172a">按主题统计学习分钟数</text>',        '<text x="32" y="78" font-family="Arial, sans-serif" font-size="15" fill="#475569">清洗后的学习日志记录,按主题分组</text>',    ]    for index, item in enumerate(summary):        y = 112 + index * 74        topic = html.escape(str(item["topic"]))        minutes = int(item["minutes"])        bar_width = int(minutes / max_minutes * bar_max_width)        color = colors[index % len(colors)]        lines.extend(            [                f'<text x="32" y="{y + 27}" font-family="Arial, sans-serif" font-size="18" fill="#0f172a">{topic}</text>',                f'<rect x="{left}" y="{y}" width="{bar_max_width}" height="34" rx="8" fill="#e2e8f0"/>',                f'<rect x="{left}" y="{y}" width="{bar_width}" height="34" rx="8" fill="{color}"/>',                f'<text x="{left + bar_max_width + 20}" y="{y + 24}" font-family="Arial, sans-serif" font-size="17" fill="#0f172a">{minutes} min</text>',            ]        )    lines.append("</svg>")    CHART_SVG.write_text("\n".join(lines), encoding="utf-8")

def write_report(summary: list[dict[str, object]], sql_rows: list[tuple[str, int, float]], cleaning_log: list[dict[str, object]]) -> None:    total_minutes = sum(int(item["minutes"]) for item in summary)    rows_html = "\n".join(        f"<tr><td>{html.escape(str(item['topic']))}</td><td>{item['minutes']}</td><td>{item['sessions']}</td><td>{item['completion_rate']}%</td><td>{item['avg_confidence']}</td></tr>"        for item in summary    )    sql_html = "\n".join(        f"<li><strong>{html.escape(topic)}</strong>:{minutes} 分钟,平均信心值 {confidence}</li>"        for topic, minutes, confidence in sql_rows    )    REPORT_HTML.write_text(        f"""<!doctype html><html lang="zh-Hans"><head>  <meta charset="utf-8" />  <title>学习日志分析报告</title>  <style>    body {{ font-family: Arial, sans-serif; max-width: 960px; margin: 32px auto; color: #0f172a; line-height: 1.6; }}    .cards {{ display: grid; grid-template-columns: repeat(3, 1fr); gap: 12px; }}    .card {{ background: #eef2ff; border-radius: 12px; padding: 16px; }}    table {{ width: 100%; border-collapse: collapse; margin-top: 16px; }}    th, td {{ border-bottom: 1px solid #cbd5e1; text-align: left; padding: 10px; }}    img {{ max-width: 100%; border: 1px solid #e2e8f0; border-radius: 12px; }}  </style></head><body>  <h1>学习日志分析报告</h1>  <p>这份报告从脏 CSV 生成,经过清洗、汇总、SQLite 查询和可视化。</p>  <section class="cards">    <div class="card"><strong>总分钟数</strong><br>{total_minutes}</div>    <div class="card"><strong>清洗后主题数</strong><br>{len(summary)}</div>    <div class="card"><strong>丢弃行数</strong><br>{len(cleaning_log)}</div>  </section>  <h2>图表</h2>  <img src="topic_minutes.svg" alt="按主题统计学习分钟数" />  <h2>主题汇总</h2>  <table>    <tr><th>主题</th><th>分钟数</th><th>次数</th><th>完成率</th><th>平均信心值</th></tr>    {rows_html}  </table>  <h2>SQLite 最高主题</h2>  <ul>{sql_html}</ul>  <h2>结论</h2>  <p>Python 的总学习时间最高。Visualization 也不错,但 Pandas 的信心值较低,下一轮练习应集中在 Pandas 分组和合并。</p></body></html>""".strip(),        encoding="utf-8",    )

def main() -> None:    write_raw_csv()    clean_rows, cleaning_log = load_and_clean(RAW_CSV)    summary = summarize_by_topic(clean_rows)    write_clean_csv(clean_rows)    write_cleaning_log(cleaning_log)    write_sqlite(clean_rows)    sql_rows = query_sqlite_top_topics()    write_svg_bar_chart(summary)    write_report(summary, sql_rows, cleaning_log)
    total_minutes = sum(int(row["minutes"]) for row in clean_rows)    completed_rows = sum(1 for row in clean_rows if row["status"] == "completed")    completion_rate = completed_rows / len(clean_rows) * 100    top_topic = summary[0]
    print(f"原始行数: {len(RAW_ROWS)}")    print(f"清洗后行数: {len(clean_rows)}")    print(f"丢弃行数: {len(cleaning_log)}")    print(f"总学习分钟数: {total_minutes}")    print(f"完成率: {completion_rate:.1f}%")    print(f"最高主题: {top_topic['topic']} ({top_topic['minutes']} 分钟)")    print("\nSQLite 前 3 个主题:")    for topic, minutes, confidence in sql_rows:        print(f"- {topic}: {minutes} 分钟,平均信心值 {confidence}")    print("\n生成的文件:")    for path in [RAW_CSV, CLEAN_CSV, CLEANING_LOG, DATABASE, CHART_SVG, REPORT_HTML]:        print(f"- {path.as_posix()}")

if __name__ == "__main__":    main()
步骤 3:运行并对照输出
Section titled “步骤 3:运行并对照输出”python3 learning_log_pipeline.py预期输出:
原始行数: 12清洗后行数: 9丢弃行数: 3总学习分钟数: 395完成率: 77.8%最高主题: Python (150 分钟)
SQLite 前 3 个主题:- Python: 150 分钟,平均信心值 0.87- Visualization: 115 分钟,平均信心值 0.83- Pandas: 70 分钟,平均信心值 0.6
生成的文件:- ch03_output/raw_learning_log.csv- ch03_output/clean_learning_log.csv- ch03_output/cleaning_log.json- ch03_output/learning_log.sqlite3- ch03_output/topic_minutes.svg- ch03_output/report.html
如果行数和统计值一致,说明流水线已经跑通。
步骤 4:阅读生成的证据
Section titled “步骤 4:阅读生成的证据”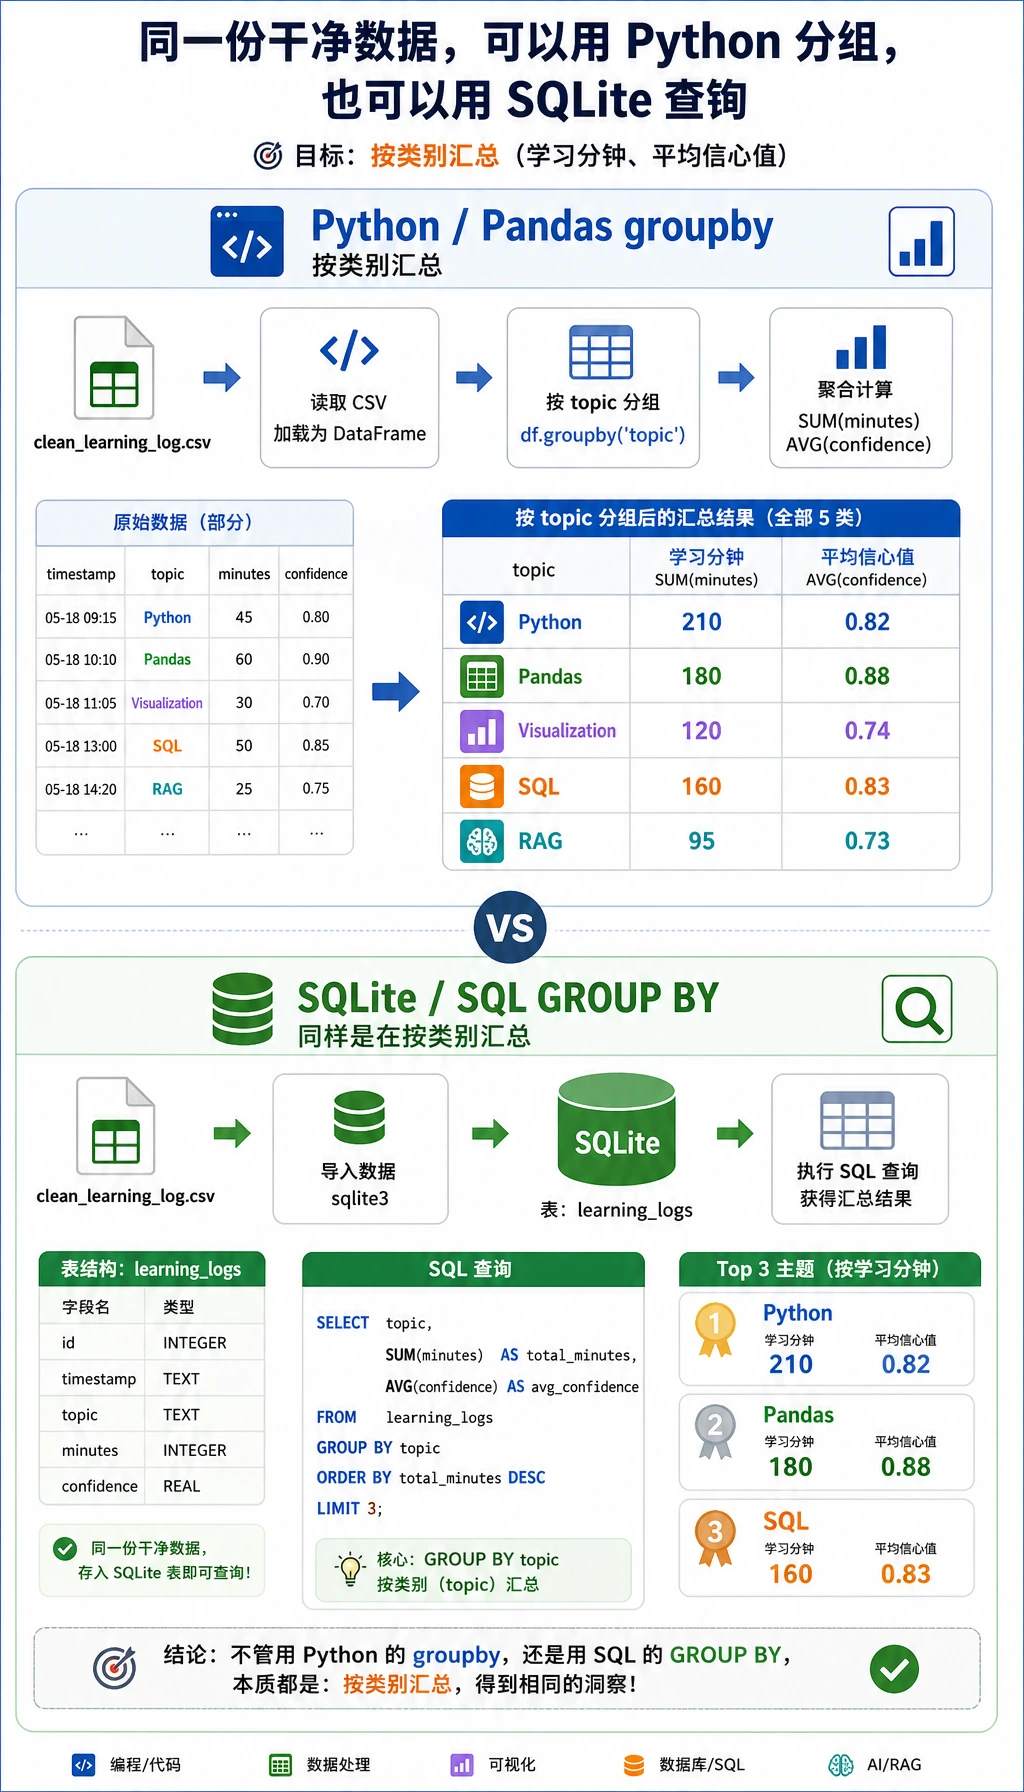
先打开 ch03_output/cleaning_log.json。它应该记录三条被丢弃的数据:一条 minutes 缺失,一条 minutes 为负数,一条重复记录。这个文件很重要,因为没有记录的数据清洗,很难让别人信任。
再检查清洗后的 CSV:
python3 - <<'PY'import csv
with open("ch03_output/clean_learning_log.csv", encoding="utf-8", newline="") as file:    rows = list(csv.DictReader(file))
print(rows[0])print("rows:", len(rows))PY
预期输出:
{'date': '2026-05-01', 'topic': 'Python', 'minutes': '45', 'status': 'completed', 'confidence': '0.92', 'note': 'loops and conditions'}rows: 9现在直接查询 SQLite 数据库:
python3 - <<'PY'import sqlite3
with sqlite3.connect("ch03_output/learning_log.sqlite3") as conn:    for row in conn.execute("SELECT topic, SUM(minutes) FROM learning_logs GROUP BY topic ORDER BY SUM(minutes) DESC"):        print(row)PY
预期输出:
('Python', 150)('Visualization', 115)('Pandas', 70)('SQL', 35)('RAG', 25)步骤 5:打开图表和报告
Section titled “步骤 5:打开图表和报告”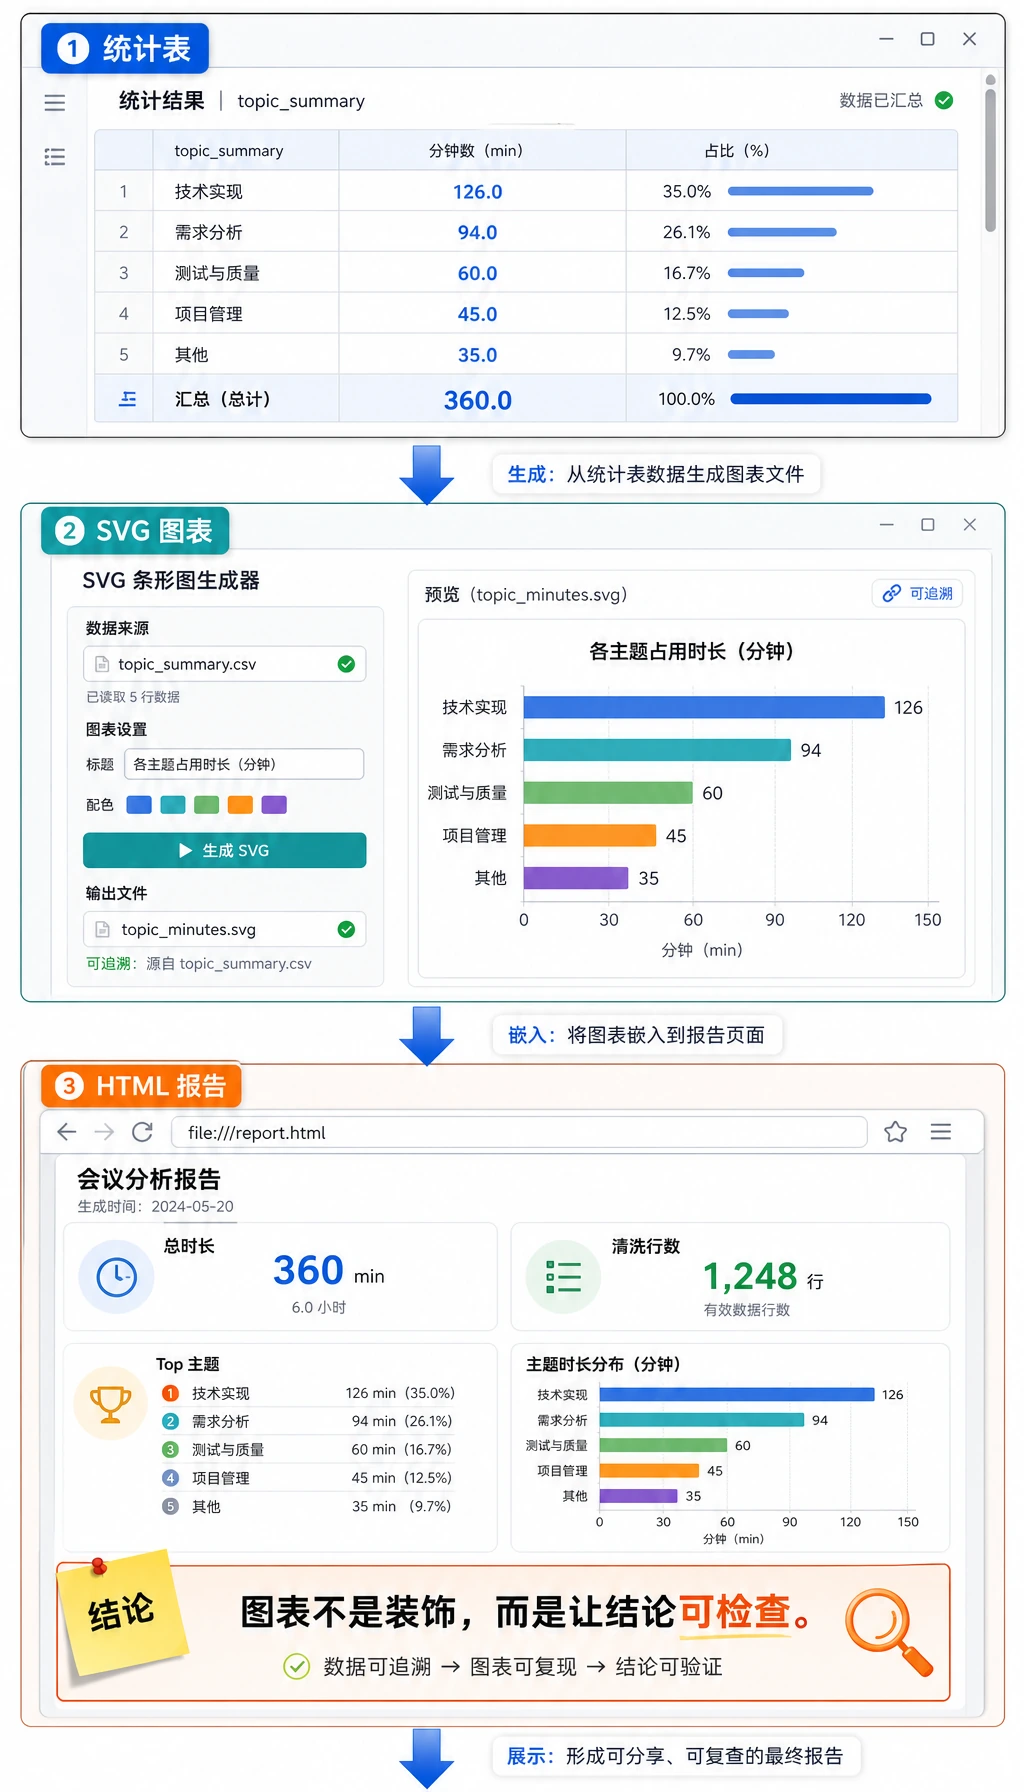
打开 HTML 报告:
# macOSopen ch03_output/report.html
# Windows PowerShellstart ch03_output/report.html
# Linuxxdg-open ch03_output/report.html
这份报告故意做得很简单。重点不是页面多漂亮,而是证明每个数字都能追溯到清洗后的行,每个结论都能被检查。
为什么这些概念重要
Section titled “为什么这些概念重要”| 术语 | 新人友好解释 |
|---|---|
CSV | 纯文本表格文件,容易查看,但不会自动保证数据质量。 |
cleaning log | 记录清洗时改了什么、为什么改,避免结论变成黑盒。 |
grouped statistics | 按类别拆分行,对每组计算指标,再比较不同组。 |
SQLite | Python 通过 sqlite3 自带的小型文件数据库。 |
SVG | 文本形式的图片格式。这里我们不安装绘图库,也能生成一张图。 |
| 可复现性 | 其他人运行同一个脚本,也能得到同样的文件和数字。 |
学完这一页,至少保留这张证据卡:
- 分析目标
- 业务/数据问题和成功标准
- 数据证据
- 来源、清洗说明、特征和图表/表格输出
- 结果
- 洞察、指标、仪表板,或报告部分
- 失败检查
- 脏数据、偏置样本、错误聚合或 Notebook 无法复现
- 期望产出
- 可复现的分析文件夹,包含数据、图表和简短报告
常见错误与修复
Section titled “常见错误与修复”| 问题 | 可能原因 | 修复 |
|---|---|---|
python3: command not found | 你的系统使用 python 而不是 python3 | 先运行 python --version,再用 python learning_log_pipeline.py |
| 输出行数不同 | 脚本被误改了 | 重新复制脚本,在干净文件夹里重跑 |
report.html 能打开但图表不显示 | HTML 文件被移出了 topic_minutes.svg 所在目录 | 让两个文件都留在 ch03_output/ 里 |
| SQLite 查询到旧数据 | 其他脚本复用了旧数据库 | 本脚本会删除并重建表,重新完整运行一次 |
| 会调用 API 但说不清结论 | 只盯着方法,没有看证据 | 按顺序读 cleaning_log.json、clean_learning_log.csv、report.html |
- 增加一条
Machine Learning记录,让minutes大于0,重跑脚本,观察图表是否变化。 - 增加一条
confidence等于1.2的记录,确认parse_confidence()会把它限制到1.0。 - 修改 SQLite 查询,只显示
status = 'stuck'的记录。 - 增加一个名为
difficulty的字段,并把它写入 CSV、SQLite 表和报告。 - 学完 Pandas 后,用 Pandas 重写
summarize_by_topic(),再和这个标准库版本对照结果。
操作参考与检查点
- 表格编辑小练习的证据应包含修改后的 CSV 或 SQLite 表,以及能证明变化的准确查询或 Pandas 语句。
- 如果 confidence 值可能超过有效范围,要裁剪或校验,并记录规则。隐藏的非法值比清楚的警告更糟。
- 新增 difficulty 之类字段时,要同时更新 CSV、数据库 schema、加载代码和报告输出,保证数据路径端到端一致。
作品集证据清单
Section titled “作品集证据清单”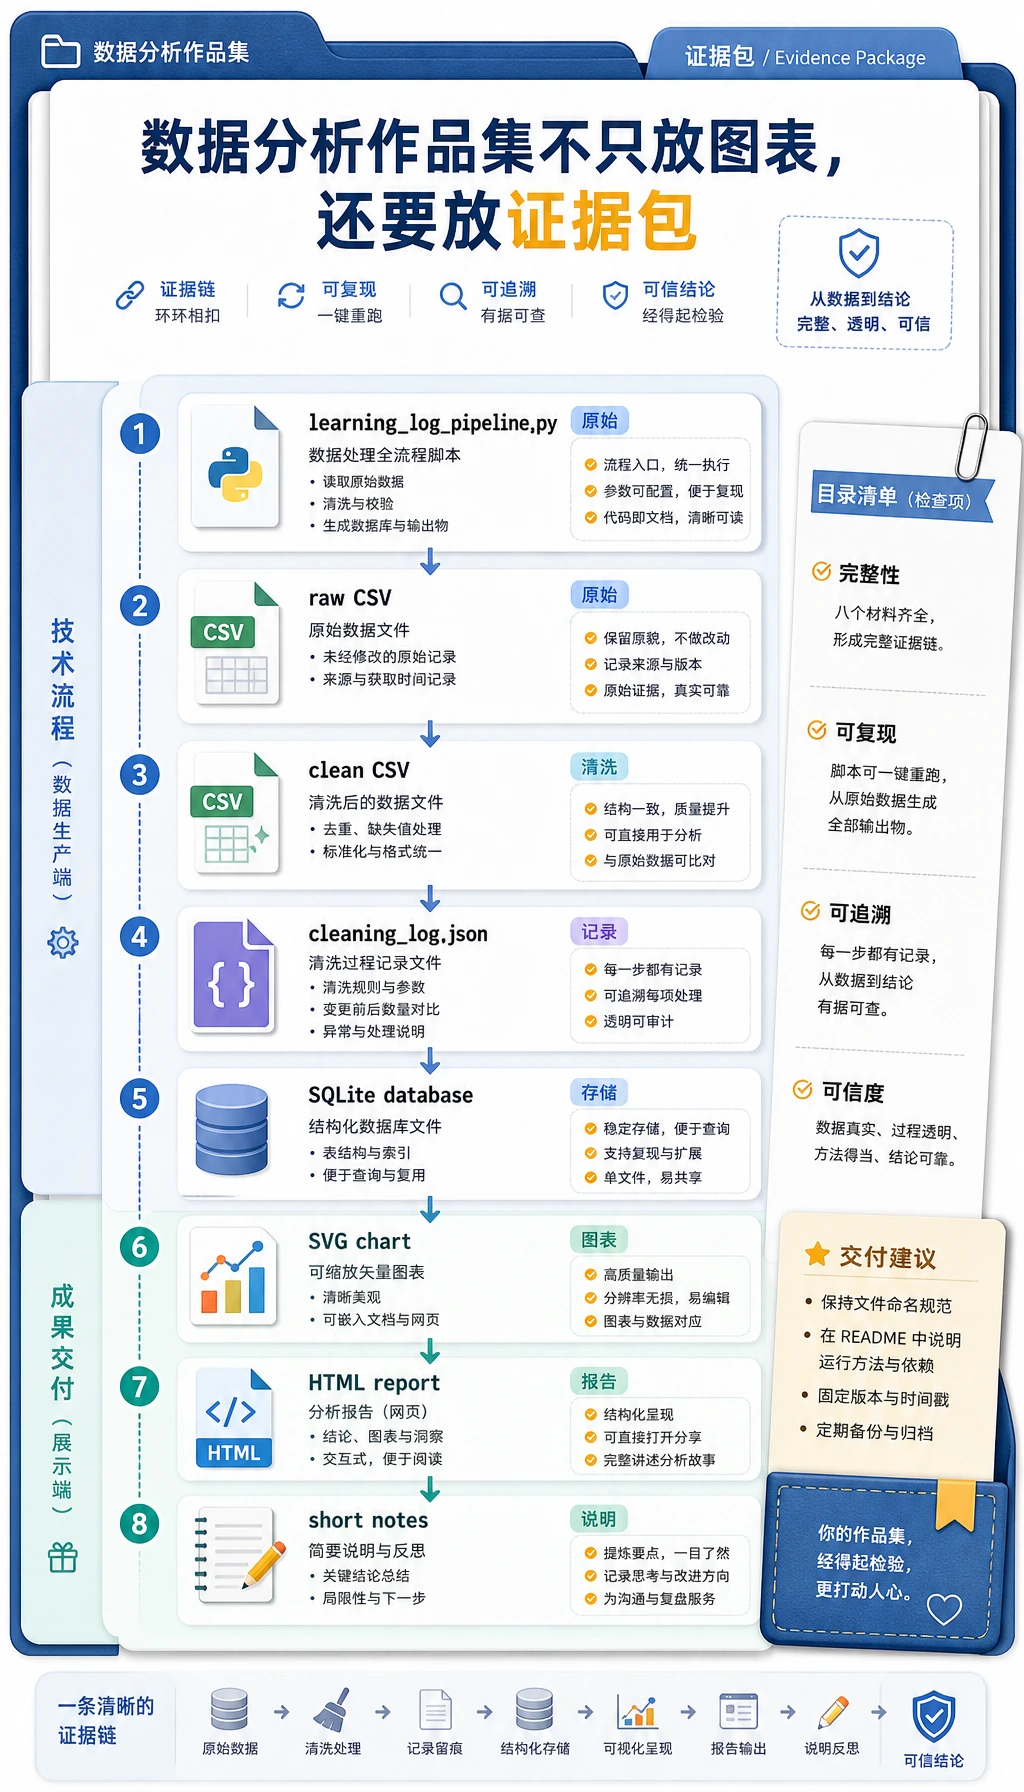
如果你把这个工作坊当成作品集练习,请保留这些材料:
- 脚本:
learning_log_pipeline.py - 原始输入:
raw_learning_log.csv - 清洗输出:
clean_learning_log.csv - 清洗记录:
cleaning_log.json - 数据库:
learning_log.sqlite3 - 图表:
topic_minutes.svg - 报告:
report.html - 一段简短说明:哪些数据被丢弃、哪个主题排名第一、下一步还想分析什么
这是数据工作的最低专业习惯:不要只展示最后的图表,也要展示让图表可信的路径。