
3.1.1 Warm-up: Processing Data with Pure Python
Learning Objectives
Section titled “Learning Objectives”- Process a real dataset using pure Python (
csvmodule + dictionaries + lists) - Experience the pain points of data processing with pure Python firsthand
- Understand why specialized data analysis tools (NumPy, Pandas) are needed
- Build intuition and motivation for the lessons ahead
Why do this warm-up?
Section titled “Why do this warm-up?”You might be thinking: “I already know Python. Why not just learn NumPy and Pandas directly?”
No rush. Let’s do a small experiment first.
It’s like riding a bicycle for 20 kilometers before learning to drive a car — only after you’ve personally experienced how “slow and tiring” a bicycle can be will you truly appreciate the value of a car.
The goal of this section: process a real dataset using pure Python, and then you’ll say that sentence — “Isn’t there an easier way?!”
The big picture of data analysis
Section titled “The big picture of data analysis”Before we start coding, let’s look at the typical data analysis workflow:
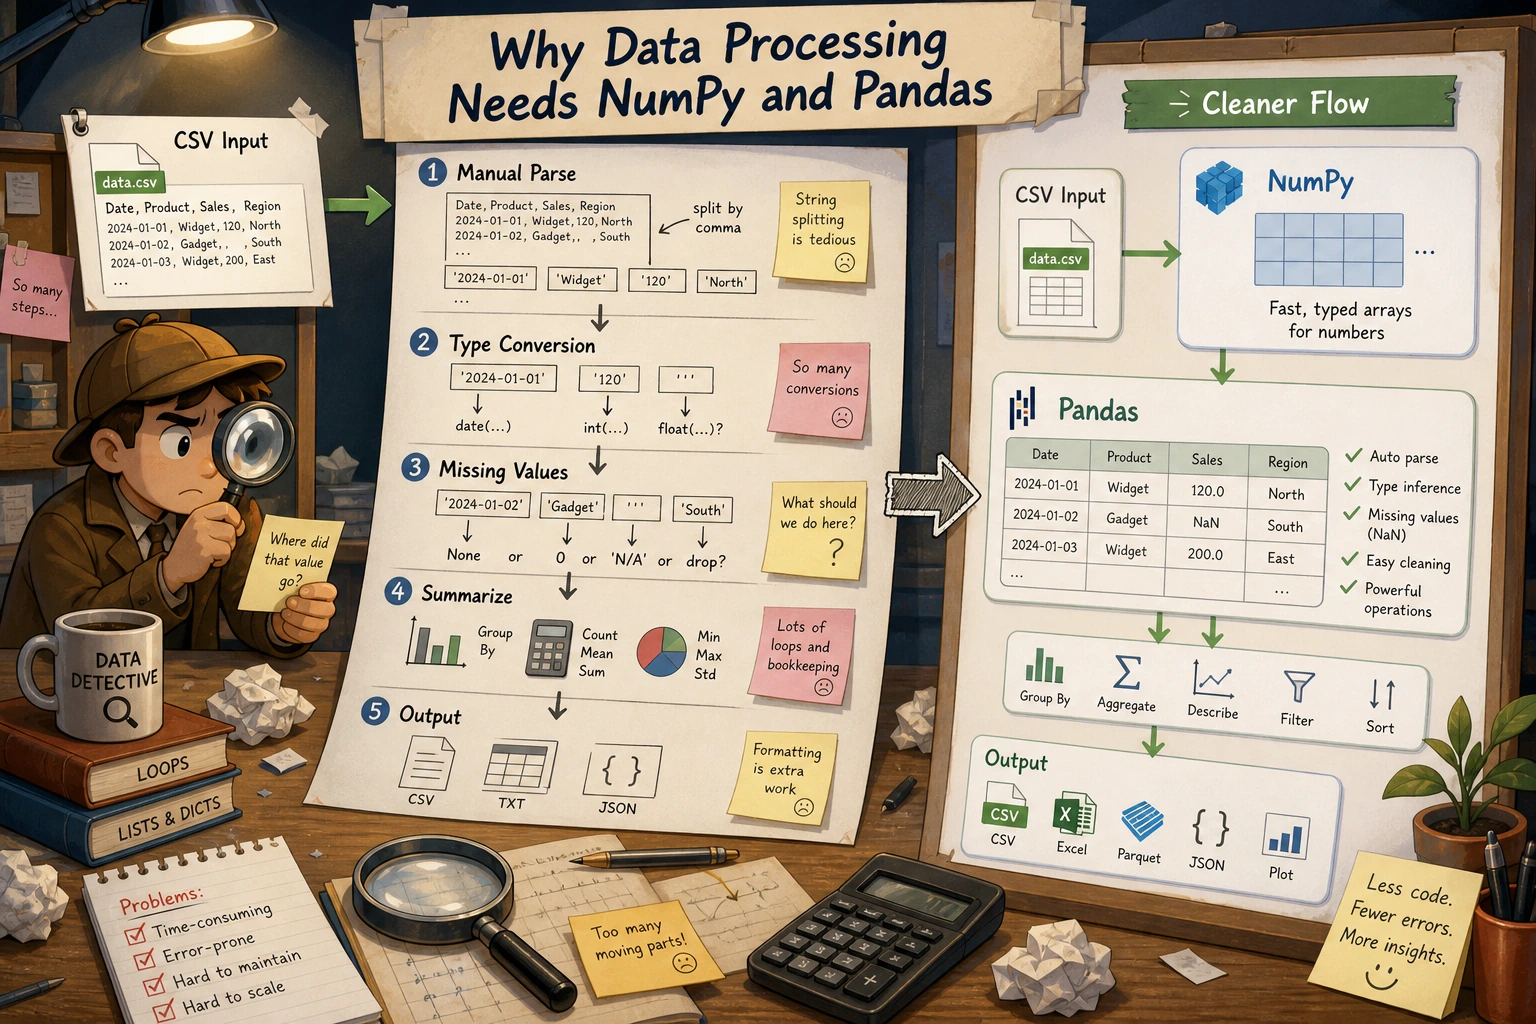
Today we’ll use pure Python to complete the first four steps. After we learn NumPy and Pandas, you’ll see that the same tasks can take 5–10x less code.
Meet our dataset: Titanic
Section titled “Meet our dataset: Titanic”We’ll use the classic Titanic dataset — one of the most common datasets for data science beginners.
Each row represents one passenger and contains the following information:
| Field | Meaning | Example Value |
|---|---|---|
PassengerId | Passenger ID | 1 |
Survived | Whether they survived (0 = died, 1 = survived) | 0 |
Pclass | Ticket class (1 = first, 2 = second, 3 = third) | 3 |
Name | Name | Braund, Mr. Owen Harris |
Sex | Sex | male |
Age | Age | 22 |
SibSp | Number of siblings/spouses aboard | 1 |
Parch | Number of parents/children aboard | 0 |
Ticket | Ticket number | A/5 21171 |
Fare | Fare | 7.25 |
Cabin | Cabin number | C85 |
Embarked | Port of embarkation (C/Q/S) | S |
Step 1: Prepare the data
Section titled “Step 1: Prepare the data”First, let’s create a small Titanic dataset for practice. Save and run the following code, and it will generate a titanic_sample.csv file:
# Create a small Titanic sample dataset
csv_content = """PassengerId,Survived,Pclass,Name,Sex,Age,SibSp,Parch,Ticket,Fare,Cabin,Embarked1,0,3,"Braund, Mr. Owen Harris",male,22,1,0,A/5 21171,7.25,,S2,1,1,"Cumings, Mrs. John Bradley",female,38,1,0,PC 17599,71.2833,C85,C3,1,3,"Heikkinen, Miss. Laina",female,26,0,0,STON/O2. 3101282,7.925,,S4,1,1,"Futrelle, Mrs. Jacques Heath",female,35,1,0,113803,53.1,C123,S5,0,3,"Allen, Mr. William Henry",male,35,0,0,373450,8.05,,S6,0,3,"Moran, Mr. James",male,,0,0,330877,8.4583,,Q7,0,1,"McCarthy, Mr. Timothy J",male,54,0,0,17463,51.8625,E46,S8,0,3,"Palsson, Master. Gosta Leonard",male,2,3,1,349909,21.075,,S9,1,3,"Johnson, Mrs. Oscar W",female,27,0,2,347742,11.1333,,S10,1,2,"Nasser, Mrs. Nicholas",female,14,1,0,237736,30.0708,,C11,1,3,"Sandstrom, Miss. Marguerite Rut",female,4,1,1,PP 9549,16.7,G6,S12,1,1,"Bonnell, Miss. Elizabeth",female,58,0,0,113783,26.55,C103,S13,0,3,"Saundercock, Mr. William Henry",male,20,0,0,A/5. 2151,8.05,,S14,0,3,"Andersson, Mr. Anders Johan",male,39,1,5,347082,31.275,,S15,0,3,"Vestrom, Miss. Hulda Amanda",female,14,0,0,350406,7.8542,,S16,1,2,"Hewlett, Mrs. Mary D",female,55,0,0,248706,16,,S17,0,3,"Rice, Master. Eugene",male,2,4,1,382652,29.125,,Q18,1,2,"Williams, Mr. Charles Eugene",male,,0,0,244373,13,,S19,0,3,"Vander Planke, Mrs. Julius",female,31,1,0,345763,18,,S20,1,3,"Masselmani, Mrs. Fatima",female,,0,0,2649,7.225,,C21,0,2,"Fynney, Mr. Joseph J",male,35,0,0,239865,26,,S22,1,2,"Beesley, Mr. Lawrence",male,34,0,0,248698,13,,S23,1,3,"McGowan, Miss. Anna",female,15,0,0,330923,8.0292,,Q24,1,1,"Sloper, Mr. William Thompson",male,28,0,0,113788,35.5,A6,S25,0,3,"Palsson, Miss. Torborg Danira",female,8,3,1,349909,21.075,,S26,1,3,"Asplund, Mrs. Carl Oscar",female,38,1,5,347077,31.3875,,S27,0,3,"Emir, Mr. Farred Chehab",male,,0,0,2631,7.225,,C28,0,1,"Fortune, Mr. Charles Alexander",male,19,3,2,19950,263,,S29,1,3,"O'Dwyer, Miss. Ellen",female,,0,0,330959,7.8792,,Q30,0,3,"Todoroff, Mr. Lalio",male,,0,0,349216,7.8958,,S"""
with open("titanic_sample.csv", "w", encoding="utf-8") as f:    f.write(csv_content)
print("✅ titanic_sample.csv has been created! (30 records)")
After running this code, you’ll see a new titanic_sample.csv file in your directory.
Step 2: Read the CSV file
Section titled “Step 2: Read the CSV file”Task: Read the CSV file into Python data structures
Section titled “Task: Read the CSV file into Python data structures”import csv
def read_csv(filename): """Read a CSV file and return a list of dictionaries""" passengers = []
with open(filename, "r", encoding="utf-8") as f: reader = csv.DictReader(f) for row in reader: passengers.append(dict(row))
return passengers
# Read the datapassengers = read_csv("titanic_sample.csv")
# Take a look at the first recordprint(f"Loaded {len(passengers)} records in total\n")print("Information for the first passenger:")for key, value in passengers[0].items(): print(f" {key}: {value}")Output summary:
| Item | Value |
|---|---|
| Records loaded | 30 |
| First passenger | Braund, Mr. Owen Harris |
| Class / sex / age | 3, male, 22 |
| Ticket / fare / embarked | A/5 21171, $7.25, S |
Step 3: Data cleaning and type conversion
Section titled “Step 3: Data cleaning and type conversion”Before analysis, we need to convert strings to the correct types and handle missing values:
def clean_data(passengers):    """Clean the data: type conversion + missing value handling"""    cleaned = []
    for p in passengers:        # Try to convert Age (some passengers have no age data)        age = None        if p["Age"] and p["Age"].strip():            try:                age = float(p["Age"])            except ValueError:                age = None
        # Convert Fare        fare = 0.0        if p["Fare"] and p["Fare"].strip():            try:                fare = float(p["Fare"])            except ValueError:                fare = 0.0
        cleaned.append({            "id": int(p["PassengerId"]),            "survived": int(p["Survived"]),            "pclass": int(p["Pclass"]),            "name": p["Name"],            "sex": p["Sex"],            "age": age,             # May be None            "sibsp": int(p["SibSp"]),            "parch": int(p["Parch"]),            "fare": fare,            "cabin": p["Cabin"] if p["Cabin"] else None,            "embarked": p["Embarked"] if p["Embarked"] else None,        })
    return cleaned
passengers = clean_data(passengers)
# Verify the cleaning resultp = passengers[0]print(f"Name: {p['name']}")print(f"Age: {p['age']} (type: {type(p['age']).__name__})")print(f"Fare: {p['fare']} (type: {type(p['fare']).__name__})")print(f"Survived: {p['survived']} (type: {type(p['survived']).__name__})")
# Check how many passengers are missing age datamissing_age = sum(1 for p in passengers if p["age"] is None)print(f"\nPassengers missing age data: {missing_age}")
By now you may already be feeling it — just reading and cleaning the data took dozens of lines of code. And this is only a small dataset!
Step 4: Data analysis tasks
Section titled “Step 4: Data analysis tasks”Now that the data is clean, let’s do a few analysis tasks.
Task 1: Count survival rates by gender
Section titled “Task 1: Count survival rates by gender”def survival_rate_by_gender(passengers): """Count survival rates by gender""" # Count total and survived passengers for males and females separately stats = {}
for p in passengers: sex = p["sex"] if sex not in stats: stats[sex] = {"total": 0, "survived": 0} stats[sex]["total"] += 1 stats[sex]["survived"] += p["survived"]
# Calculate survival rates print("=== Survival Rate by Gender ===") print(f"{'Gender':<10}{'Total':<10}{'Survived':<10}{'Survival Rate'}") print("-" * 40)
for sex, data in stats.items(): rate = data["survived"] / data["total"] * 100 print(f"{sex:<10}{data['total']:<10}{data['survived']:<10}{rate:.1f}%")
survival_rate_by_gender(passengers)Output:
=== Survival Rate by Gender ===Gender Total Survived Survival Rate----------------------------------------male 14 3 21.4%female 16 13 81.2%Historical fact: The “women and children first” rule was indeed enforced when the Titanic sank — women had a much higher survival rate than men.
Task 2: Find the top 5 passengers with the highest fares
Section titled “Task 2: Find the top 5 passengers with the highest fares”def top_fare_passengers(passengers, n=5): """Find the top n passengers with the highest fares""" # Sort by fare (you have to write the sorting logic manually) sorted_passengers = sorted(passengers, key=lambda p: p["fare"], reverse=True)
print(f"\n=== Top {n} Passengers by Fare ===") print(f"{'Rank':<6}{'Name':<35}{'Class':<6}{'Fare'}") print("-" * 60)
for i, p in enumerate(sorted_passengers[:n], 1): pclass_name = {1: "First", 2: "Second", 3: "Third"}[p["pclass"]] print(f"{i:<6}{p['name']:<35}{pclass_name:<6}${p['fare']:.2f}")
top_fare_passengers(passengers)Output summary:
| Rank | Passenger | Fare |
|---|---|---|
| 1 | Fortune, Mr. Charles Alexander | $263.00 |
| 2 | Cumings, Mrs. John Bradley | $71.28 |
| 3 | Futrelle, Mrs. Jacques Heath | $53.10 |
| 4 | McCarthy, Mr. Timothy J | $51.86 |
| 5 | Sloper, Mr. William Thompson | $35.50 |
Task 3: Group by class and calculate average age
Section titled “Task 3: Group by class and calculate average age”This task shows most clearly how painful pure Python data processing can be:
def avg_age_by_class(passengers):    """Group by ticket class and calculate average age"""    # Step 1: group by ticket class    groups = {}  # {pclass: [age1, age2, ...]}
    for p in passengers:        pclass = p["pclass"]        if pclass not in groups:            groups[pclass] = []
        # Only include passengers with age data        if p["age"] is not None:            groups[pclass].append(p["age"])
    # Step 2: calculate statistics for each group    print("\n=== Age Statistics by Ticket Class ===")    print(f"{'Class':<10}{'Count':<10}{'Average Age':<12}{'Max Age':<12}{'Min Age'}")    print("-" * 55)
    for pclass in sorted(groups.keys()):        ages = groups[pclass]        if ages:            avg = sum(ages) / len(ages)            max_age = max(ages)            min_age = min(ages)            pclass_name = {1: "First Class", 2: "Second Class", 3: "Third Class"}[pclass]            print(f"{pclass_name:<10}{len(ages):<10}{avg:<12.1f}{max_age:<12.0f}{min_age:.0f}")
avg_age_by_class(passengers)
Output:
=== Age Statistics by Ticket Class ===Class Count Average Age Max Age Min Age-------------------------------------------------------First Class 5 39.4 58 19Second Class 4 34.5 55 14Third Class 14 19.4 39 2Task 4: Calculate average fare by embarkation port
Section titled “Task 4: Calculate average fare by embarkation port”def avg_fare_by_embarked(passengers): """Calculate the average fare for each embarkation port""" port_names = {"S": "Southampton", "C": "Cherbourg", "Q": "Queenstown"} groups = {}
for p in passengers: port = p["embarked"] if port is None: continue if port not in groups: groups[port] = [] groups[port].append(p["fare"])
print("\n=== Fare Statistics by Embarkation Port ===") print(f"{'Port':<20}{'Count':<10}{'Average Fare':<15}{'Total Fare'}") print("-" * 55)
for port, fares in sorted(groups.items()): avg = sum(fares) / len(fares) total = sum(fares) name = port_names.get(port, port) print(f"{name:<20}{len(fares):<10}${avg:<14.2f}${total:.2f}")
avg_fare_by_embarked(passengers)Step 5: Feel the pain points
Section titled “Step 5: Feel the pain points”Let’s review the problems we encountered when doing these analyses with pure Python:
root((Pain points of<br/>pure Python data processing)) Type conversion Everything from CSV is a string Every field must be converted manually Missing value handling is tedious Group statistics Handwritten loops and dictionaries Lots of repeated code Need to rewrite for each new dimension Sorting and filtering Need sorted + lambda every time Multi-condition filtering requires nested if statements No convenient functions Need sum/len for averages No built-in median function No one-click deduplication and counting Visualization Pure Python cannot plot directly Extra visualization libraries are neededPain point summary table
Section titled “Pain point summary table”| Pain point | Pure Python approach | How much code |
|---|---|---|
| Read CSV | csv.DictReader + manual type conversion | ~30 lines |
| Calculate survival rate by gender | Handwritten dictionary grouping + loop-based calculation | ~15 lines |
| Sort and take top N | sorted() + slicing + formatted output | ~10 lines |
| Group by class and compute mean | Handwritten dictionary grouping + manual missing-value filtering + manual calculation | ~20 lines |
Total: About 75–100 lines of code to complete 4 simple analysis tasks.
Step 6: Preview — how much code would Pandas need for the same tasks?
Section titled “Step 6: Preview — how much code would Pandas need for the same tasks?”Don’t rush into Pandas syntax yet. Just look at the comparison in results:
# ⚠️ This is a preview! We will learn each line in detail later
import pandas as pd
# Read + automatic type conversion (1 line, replacing your 30 lines)df = pd.read_csv("titanic_sample.csv")
# Survival rate by gender (1 line, replacing your 15 lines)print(df.groupby("Sex")["Survived"].mean())
# Top 5 passengers by fare (1 line, replacing your 10 lines)print(df.nlargest(5, "Fare")[["Name", "Pclass", "Fare"]])
# Average age by class (1 line, replacing your 20 lines)print(df.groupby("Pclass")["Age"].mean())
# Average fare by port (1 line)print(df.groupby("Embarked")["Fare"].mean())
5 lines of Pandas code = 75 lines of pure Python code.
And Pandas also handles type conversion and missing values automatically, so you don’t need to write any extra code.
Code length comparison
Section titled “Code length comparison”xychart-beta title "Code Lines Comparison: Pure Python vs Pandas" x-axis ["Read data", "Gender survival rate", "Top 5 fares", "Grouped mean", "Total"] y-axis "Number of code lines" 0 --> 100 bar [30, 15, 10, 20, 75] bar [1, 1, 1, 1, 5]Hands-on exercises
Section titled “Hands-on exercises”Exercise 1: Calculate the average fare for survivors and non-survivors
Section titled “Exercise 1: Calculate the average fare for survivors and non-survivors”Use pure Python to compute:
- The average fare for survivors
- The average fare for non-survivors
- The difference between them
def avg_fare_by_survival(passengers):    """Calculate the average fare for survivors and non-survivors"""    # Hint: similar to grouping by gender    # survived == 1 means survived, survived == 0 means did not survive    groups = {0: [], 1: []}    for p in passengers:        groups[p["survived"]].append(p["fare"])
    for survived, fares in groups.items():        label = "Survived" if survived else "Did not survive"        average = sum(fares) / len(fares) if fares else 0        print(f"{label}: {average:.2f}")
avg_fare_by_survival(passengers)
Think about it: what is the relationship between fare (ticket class) and survival rate?
Exercise 2: Find all child passengers (age < 18)
Section titled “Exercise 2: Find all child passengers (age < 18)”def find_children(passengers): """Find all passengers under 18 years old""" # Note: handle the case where age is None children = [] for p in passengers: age = p.get("age") if age is not None and age < 18: children.append(p)
print(f"There are {len(children)} child passengers:") for c in children: status = "survived" if c["survived"] else "did not survive" print(f" {c['name']}, {c['age']:.0f} years old, {status}")
# Calculate the survival rate for children if children: survival_rate = sum(1 for c in children if c["survived"]) / len(children) * 100 print(f"Child survival rate: {survival_rate:.1f}%") else: print("Child survival rate: N/A")
find_children(passengers)Exercise 3: Summary statistics table
Section titled “Exercise 3: Summary statistics table”Generate a summary statistics table with these fields:
| Metric | Example value |
|---|---|
| Total passengers | 30 |
| Survived | 16 (53.3%) |
| Average age / fare | 26.8 years old, $31.23 |
| Male / female passengers | 14 (46.7%), 16 (53.3%) |
| Missing age / cabin | 7 (23.3%), 21 (70.0%) |
Challenge exercise: Cross-analysis
Section titled “Challenge exercise: Cross-analysis”Calculate the survival rate for males and females within each ticket class (cross-tabulation of 2 dimensions):
=== Survival Rate by Gender Within Each Class === Male Survival Rate Female Survival RateFirst 33.3% 100.0%Second 50.0% 100.0%Third 0.0% 62.5%Hint: you need to group by two fields at the same time (pclass + sex). Try it and see how many lines of code it takes.
Reference implementation and walkthrough
- For the passenger exercise, group by
survivedfirst and compute counts, average fare, and class distribution before interpreting anything. - When adding age logic, treat missing ages as
Unknowninstead of pretending they are children or adults. The useful comparison is child survival rate versus adult survival rate, with the number of samples shown beside each rate. - For the class and gender crosstab, a good answer reports both raw counts and percentages. The explanation should say these are associations in the dataset, not proof that fare, class, or gender caused survival.
Complete code for this section
Section titled “Complete code for this section”Combine all the code above into one file:
"""Pure Python Data Analysis Warm-upDataset: TitanicGoal: Experience the pain points of data processing with pure Python and prepare for NumPy/Pandas"""
import csv

def read_csv(filename: str) -> list[dict]:    """Read a CSV file"""    with open(filename, "r", encoding="utf-8") as f:        return [dict(row) for row in csv.DictReader(f)]

def clean_data(passengers: list[dict]) -> list[dict]:    """Data cleaning: type conversion + missing value handling"""    cleaned = []    for p in passengers:        age = None        if p["Age"] and p["Age"].strip():            try:                age = float(p["Age"])            except ValueError:                age = None
        fare = 0.0        if p["Fare"] and p["Fare"].strip():            try:                fare = float(p["Fare"])            except ValueError:                fare = 0.0
        cleaned.append({            "id": int(p["PassengerId"]),            "survived": int(p["Survived"]),            "pclass": int(p["Pclass"]),            "name": p["Name"],            "sex": p["Sex"],            "age": age,            "fare": fare,            "cabin": p["Cabin"] if p["Cabin"] else None,            "embarked": p["Embarked"] if p["Embarked"] else None,        })    return cleaned

def analyze(passengers: list[dict]) -> None:    """Run all analysis tasks"""
    # Task 1: Gender survival rate    print("=== Survival Rate by Gender ===")    gender_stats = {}    for p in passengers:        sex = p["sex"]        if sex not in gender_stats:            gender_stats[sex] = {"total": 0, "survived": 0}        gender_stats[sex]["total"] += 1        gender_stats[sex]["survived"] += p["survived"]
    for sex, data in gender_stats.items():        rate = data["survived"] / data["total"] * 100        print(f"  {sex}: {data['survived']}/{data['total']} ({rate:.1f}%)")
    # Task 2: Top 5 fares    print(f"\n=== Top 5 Passengers by Fare ===")    sorted_by_fare = sorted(passengers, key=lambda p: p["fare"], reverse=True)    for i, p in enumerate(sorted_by_fare[:5], 1):        print(f"  {i}. {p['name'][:30]:<32} ${p['fare']:.2f}")
    # Task 3: Average age by class    print(f"\n=== Average Age by Class ===")    class_ages = {}    for p in passengers:        pc = p["pclass"]        if pc not in class_ages:            class_ages[pc] = []        if p["age"] is not None:            class_ages[pc].append(p["age"])
    for pc in sorted(class_ages.keys()):        ages = class_ages[pc]        avg = sum(ages) / len(ages) if ages else 0        label = {1: "First Class", 2: "Second Class", 3: "Third Class"}[pc]        print(f"  {label}: {avg:.1f} years old ({len(ages)} passengers)")

if __name__ == "__main__":    raw = read_csv("titanic_sample.csv")    passengers = clean_data(raw)    print(f"Loaded {len(passengers)} records in total\n")    analyze(passengers)
Evidence to Keep
Section titled “Evidence to Keep”Keep this page’s proof of learning as a small evidence card:
- Data Source
- raw records or small dataset used
- Processing Step
- pure Python, NumPy, Pandas, charting, or SQL operation
- Output
- cleaned data, statistic, chart, query result, or report note
- Failure Check
- missing data, shape mismatch, wrong aggregation, or unclear question
- Expected Output
- data artifact plus the evidence needed to trust it
Summary
Section titled “Summary”| Key point | Explanation |
|---|---|
| CSV data comes in as strings | Every field requires manual int() / float() conversion |
| Missing value handling is tedious | You must check for empty values one by one and use try/except to avoid conversion errors |
| Group statistics require a lot of code | Every grouping task needs handwritten dictionaries and loops |
| Basic statistics functions are lacking | There are no built-in mean, median, standard deviation, etc. helpers |
| Poor code reusability | If the grouping dimension changes, you often need to rewrite the whole block |
What’s next?
Section titled “What’s next?”The learning path looks like this:
flowchart TD    A["✅ Chapter 1: Pure Python Warm-up (you are here)"] --> B["Chapter 2: NumPy for Scientific Computing"]    B --> C["Chapter 3: Pandas for Data Processing"]    C --> D["Chapter 4: Data Visualization"]    D --> E["3.6 Stage Projects"]
    B -- "Solves pain points" --> B1["Efficient array operations<br/>No loops needed<br/>Vectorized computation"]    C -- "Solves pain points" --> C1["Read CSV in 1 line<br/>Automatic type conversion<br/>Grouped stats in 1 line"]    D -- "Solves pain points" --> D1["Present data with charts<br/>Discover patterns intuitively"]
    style A fill:#4caf50,color:#fff    style B fill:#2196f3,color:#fff    style C fill:#2196f3,color:#fff    style D fill:#2196f3,color:#fff    style E fill:#ff9800,color:#fff
Ready? Let’s enter the world of NumPy!