
5.6.4 Project 3: User Segmentation Analysis (Clustering Problem)
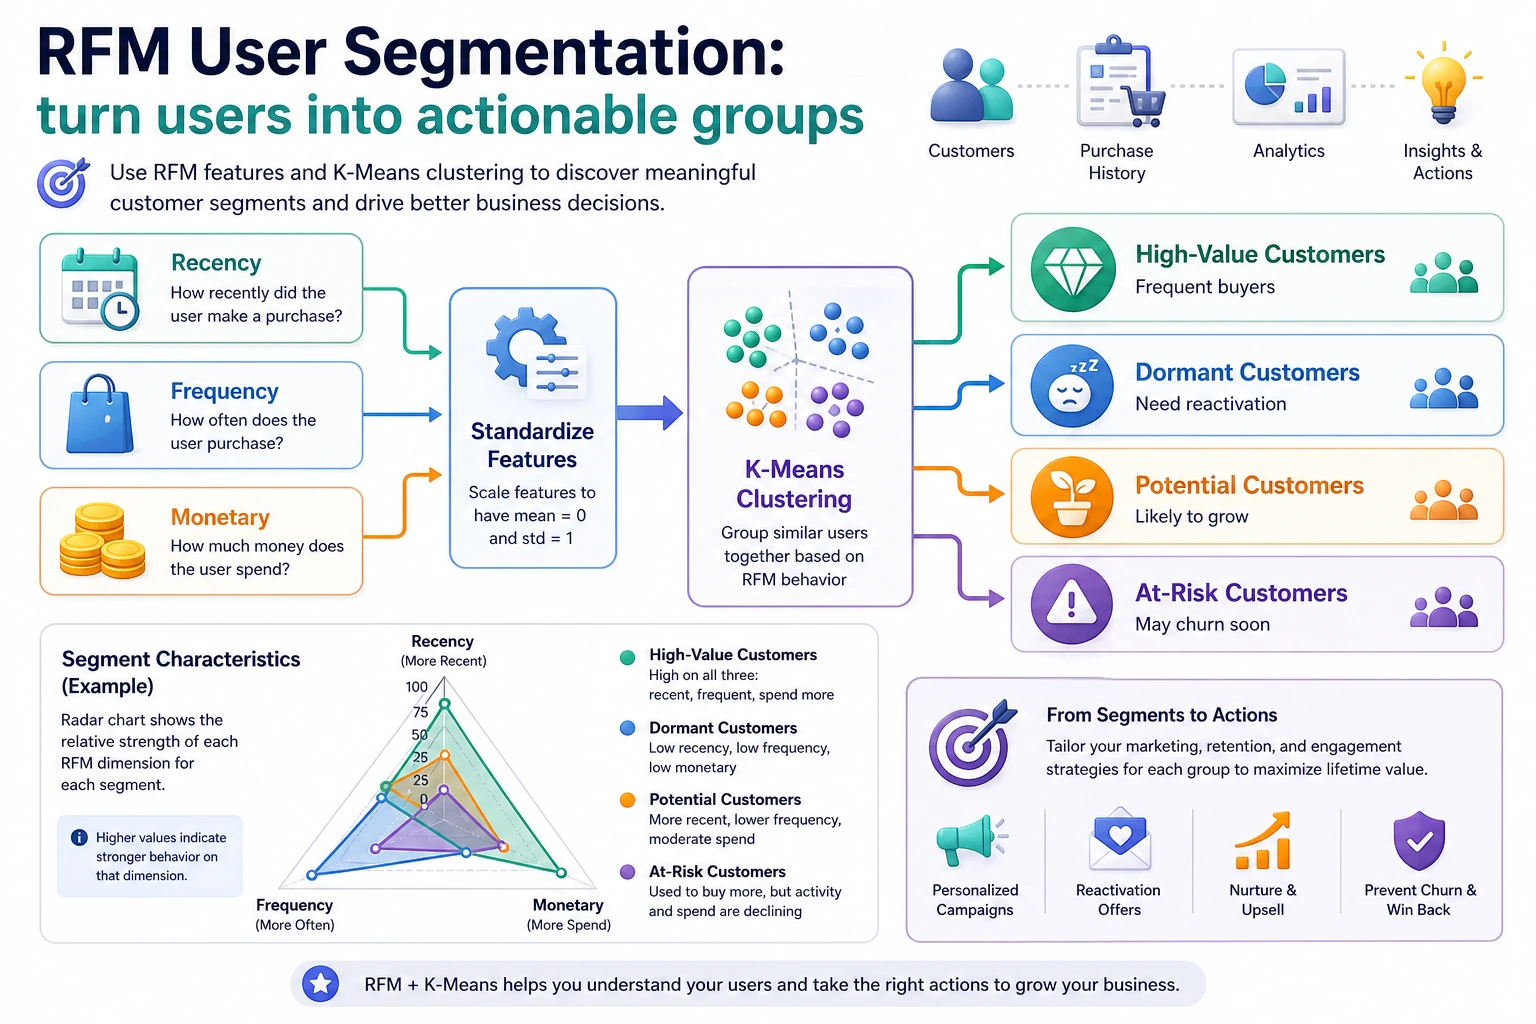
Project Overview
Section titled “Project Overview”| Information | Description |
|---|---|
| Task type | Clustering (unsupervised) |
| Method | RFM model + K-Means |
| Evaluation metric | Silhouette score |
| Skills involved | Feature engineering, standardization, dimensionality reduction, clustering, business interpretation |
Key Terms Before You Read the Code
Section titled “Key Terms Before You Read the Code”- RFM (Recency, Frequency, Monetary) is a customer-value framework: how recently a customer purchased, how often they purchased, and how much they spent.
- K-Means is a clustering algorithm that groups samples by distance to cluster centers. It is simple and fast, but it needs you to choose
K, the number of groups. - K means the number of clusters. In business segmentation,
Kshould be chosen by both metrics and whether the groups can be explained. - Standardization puts features onto comparable scales. Without it,
monetarymay dominaterecencyandfrequencysimply because the number is larger. - PCA (Principal Component Analysis) compresses high-dimensional features into fewer axes for visualization. It helps you draw the groups, but it does not replace business interpretation.
- Silhouette score measures whether samples are closer to their own group than to other groups. Higher is usually better, but a business-useless cluster is still not a good cluster.
First, let’s set a very important learning expectation
Section titled “First, let’s set a very important learning expectation”The easiest trap for beginners in this question is not that clustering won’t run, but that the project can easily turn into something like this:
- The charts look great
- The group names are also created
- But in business terms, you still don’t know how to use it
What is more worth practicing on the first pass is not making the clustering plot prettier, but:
How to truly translate “group structure” into “actionable user personas and strategies.”
As long as you establish that line first, this question will feel much more like a real project and less like a visualization exercise.
Let’s build a map first
Section titled “Let’s build a map first”This task is easiest to make into “nice-looking charts, but hollow explanations.” So the safest way to proceed is not to run clustering first, but to first think through “what kind of groups count as valuable.”
flowchart LR    A["First define business features<br/>RFM"] --> B["Then standardize and choose K"]    B --> C["Then cluster and visualize"]    C --> D["Then name the groups"]    D --> E["Finally, give action recommendations"]
    style A fill:#e3f2fd,stroke:#1565c0,color:#333    style E fill:#e8f5e9,stroke:#2e7d32,color:#333
The most important thing in an unsupervised project is not that “the algorithm finished running,” but whether you can tell the clustering results as an actionable customer persona story.
What you are really practicing in this task
Section titled “What you are really practicing in this task”The real difficulty of this project is not getting clustering labels, but:
- Defining features in business language
- Judging whether the K value is reasonable
- Interpreting clustering results as “actionable customer groups”
What should be confirmed first in the first version of this task
Section titled “What should be confirmed first in the first version of this task”When doing this task for the first time, the most important things to confirm first are:
- Whether the features you chose are truly meaningful in business terms
- Whether the direction of each feature makes sense
- How you ultimately plan to name the groups
Because in a clustering project, the upper limit of all later “interpretation quality” is often already determined at the feature-definition step.
A more beginner-friendly analogy
Section titled “A more beginner-friendly analogy”You can think of this task as:
- Creating an “actionable tiered list” for a large group of users
The key point is not:
- The machine blindly dividing people into several categories
But rather:
- Whether these tiers can truly help operations, marketing, or product teams take different actions
So the most valuable parts of this task are not clustering itself, but:
- Naming
- Explaining
- Action recommendations
Recommended workflow
Section titled “Recommended workflow”- First explain the meaning of RFM clearly
- Then do standardization and choose K
- Then make PCA visualizations
- Finally, write group naming and business recommendations
Unsupervised projects are most afraid of “the chart is done, but the explanation is missing.”
The safest default order for your first attempt
Section titled “The safest default order for your first attempt”If this is your first time doing user segmentation, I recommend the following order:
- First clarify the business objective
- First confirm why RFM is used for the persona features
- First do standardization and choose K
- First create statistical profiles for each group
- Then use a PCA chart for presentation
- Only then write group naming and business recommendations
This will be more stable because what you establish first is:
- Feature semantics
- Clustering basis
- Group profiles
- Business actions
This complete chain, instead of being led by the chart first.
Step 1: Generate RFM data
Section titled “Step 1: Generate RFM data”import pandas as pdimport numpy as npimport matplotlib.pyplot as plt
rng = np.random.default_rng(seed=42)n_customers = 1000
df = pd.DataFrame({ 'customer_id': range(1, n_customers + 1), 'recency': rng.exponential(30, n_customers).astype(int) + 1, # Days since last purchase 'frequency': rng.poisson(5, n_customers) + 1, # Purchase frequency 'monetary': rng.exponential(200, n_customers).round(2) + 10, # Total spending})
print(df.describe())RFM introduction
Section titled “RFM introduction”| Metric | Meaning | What a larger value means |
|---|---|---|
| Recency | Days since last purchase | Smaller is better (purchased more recently) |
| Frequency | Purchase frequency | Larger is better (repeat customer) |
| Monetary | Total spending | Larger is better (high spender) |
Step 1.1 Why RFM is especially suitable as a first clustering project
Section titled “Step 1.1 Why RFM is especially suitable as a first clustering project”Because it has two advantages that are great for beginners:
- The business semantics are very clear
- The later group interpretation is naturally smoother
In other words, you are not clustering a pile of abstract numbers, but segmenting based on three very intuitive behaviors:
- Whether they bought recently
- How often they buy
- How much they spend
Step 2: Feature standardization and clustering
Section titled “Step 2: Feature standardization and clustering”from sklearn.preprocessing import StandardScalerfrom sklearn.cluster import KMeans
features = ['recency', 'frequency', 'monetary']scaler = StandardScaler()X_scaled = scaler.fit_transform(df[features])
# Use the elbow method to choose Kinertias = []sil_scores = []K_range = range(2, 9)
from sklearn.metrics import silhouette_scorefor k in K_range: km = KMeans(n_clusters=k, random_state=42, n_init=10) labels = km.fit_predict(X_scaled) inertias.append(km.inertia_) sil_scores.append(silhouette_score(X_scaled, labels))
fig, axes = plt.subplots(1, 2, figsize=(12, 4))axes[0].plot(K_range, inertias, 'bo-')axes[0].set_xlabel('K')axes[0].set_ylabel('Inertia')axes[0].set_title('Elbow Method')
axes[1].plot(K_range, sil_scores, 'ro-')axes[1].set_xlabel('K')axes[1].set_ylabel('Silhouette Score')axes[1].set_title('Silhouette Score Method')
plt.tight_layout()plt.show()Step 3: Clustering and visualization
Section titled “Step 3: Clustering and visualization”from sklearn.decomposition import PCA
# Select the best Kbest_k = K_range[np.argmax(sil_scores)]print(f"Best K: {best_k}, Silhouette score: {max(sil_scores):.4f}")
km = KMeans(n_clusters=best_k, random_state=42, n_init=10)df['cluster'] = km.fit_predict(X_scaled)
# PCA dimensionality reduction visualizationpca = PCA(n_components=2)X_2d = pca.fit_transform(X_scaled)
plt.figure(figsize=(8, 6))scatter = plt.scatter(X_2d[:, 0], X_2d[:, 1], c=df['cluster'], cmap='Set2', s=15, alpha=0.6)plt.colorbar(scatter, label='Cluster')plt.xlabel(f'PC1 ({pca.explained_variance_ratio_[0]:.1%})')plt.ylabel(f'PC2 ({pca.explained_variance_ratio_[1]:.1%})')plt.title('User Segmentation (PCA Projection)')plt.show()Step 3.1 How to interpret the PCA chart
Section titled “Step 3.1 How to interpret the PCA chart”The main purpose of this chart is to help you:
- See whether the groups are roughly separated
- See whether there are obvious outlier groups
- Support presentation of the results
But it is not the final proof. What really determines project quality is still the later part:
- Group statistical profiles
- Whether naming is reasonable
- Whether business recommendations are actionable
Step 4: Interpret the clustering results
Section titled “Step 4: Interpret the clustering results”# RFM statistics for each groupcluster_summary = df.groupby('cluster')[features].mean().round(1)cluster_summary['Customer Count'] = df.groupby('cluster').size()print(cluster_summary)
# Radar chartfig, axes = plt.subplots(1, best_k, figsize=(4*best_k, 4), subplot_kw=dict(polar=True))if best_k == 1: axes = [axes]
angles = np.linspace(0, 2*np.pi, len(features), endpoint=False).tolist()angles += angles[:1]
# Normalize to [0, 1] for comparisonfrom sklearn.preprocessing import MinMaxScalermms = MinMaxScaler()radar_data = mms.fit_transform(cluster_summary[features])# Smaller recency is better, so flip itradar_data[:, 0] = 1 - radar_data[:, 0]
for i, ax in enumerate(axes): values = radar_data[i].tolist() + [radar_data[i][0]] ax.fill(angles, values, alpha=0.25) ax.plot(angles, values, linewidth=2) ax.set_xticks(angles[:-1]) ax.set_xticklabels(['Recent Activity', 'Purchase Frequency', 'Spending']) ax.set_title(f'Group {i}', pad=15)
plt.suptitle('RFM Radar Chart for Each Group', y=1.02, fontsize=13)plt.tight_layout()plt.show()Step 5: Business recommendations
Section titled “Step 5: Business recommendations”# Assign labels and recommendations based on clustering featuresprint("\n=== Business Recommendations ===")for i in range(best_k): row = cluster_summary.loc[i] label = "" suggestion = "" if row['recency'] < cluster_summary['recency'].median() and row['monetary'] > cluster_summary['monetary'].median(): label = "High-Value Active Customers" suggestion = "VIP service, exclusive discounts, and loyalty retention" elif row['recency'] > cluster_summary['recency'].median() and row['monetary'] > cluster_summary['monetary'].median(): label = "High-Value At-Risk Customers" suggestion = "Win-back campaigns and personalized recommendations" elif row['frequency'] > cluster_summary['frequency'].median(): label = "High-Frequency Low-Spend Customers" suggestion = "Increase average order value and cross-sell" else: label = "Low-Activity Customers" suggestion = "Low-cost outreach and coupon activation"
print(f" Group {i} ({int(row['Customer Count'])} people): {label}") print(f" Recommendation: {suggestion}")Step 5.1 A very practical template for naming groups
Section titled “Step 5.1 A very practical template for naming groups”You can use the following template for naming:
- First look at activity level
- Then look at value
- Finally look at risk
For example:
- High-Value Active Customers
- High-Value At-Risk Customers
- High-Frequency Low-AOV Customers
- Low-Activity Customers to Reactivate
The advantage of this naming style is that business stakeholders can immediately see what action to take.
What is best to include in the project deliverable
Section titled “What is best to include in the project deliverable”- A K-selection curve chart
- A PCA clustering visualization
- A group profiling table
- A paragraph explaining “why these groups were named this way”
A more complete project delivery structure
Section titled “A more complete project delivery structure”- Why RFM was chosen for persona modeling
- How K was selected
- What the profile of each group is
- Why they were named that way
- What strategy corresponds to each group
- If further iteration continues, what features should be added next
What is most worth showing in a portfolio
Section titled “What is most worth showing in a portfolio”- The basis for choosing K
- The RFM profile table for each group
- A clustering visualization chart
- A one-page table of group names and strategies
- A paragraph judging whether this clustering truly has business value
Project checklist
Section titled “Project checklist”- Build RFM features
- Standardize + use the elbow method / silhouette score to choose K
- Use PCA to visualize clustering results
- Analyze the RFM characteristics of each group
- Provide actionable business recommendations
Project reference and review notes
- RFM features need a clear observation window. Without a time window, recency and frequency are hard to interpret.
- Standardize RFM before K-Means because monetary scale can otherwise dominate distance.
- Choose K with both evidence and usefulness: elbow/silhouette scores plus cluster profiles that can be named and acted on.
- PCA is a visualization aid. Do not treat the 2D chart as the full clustering proof; keep the profile table as the main evidence.
- Business recommendations should match the group profile. If clusters are unstable or not actionable, the honest answer is to improve features before acting.
Suggested version roadmap
Section titled “Suggested version roadmap”| Version | Goal | Delivery focus |
|---|---|---|
| Basic version | Complete the minimum closed loop | Can input, process, output, and retain one set of examples |
| Standard version | Form a presentable project | Add configuration, logging, error handling, README, and screenshots |
| Challenge version | Close to portfolio quality | Add evaluation, comparison experiments, failure case analysis, and next-step roadmap |
It is recommended to finish the basic version first; do not chase a large all-in-one solution at the beginning. Every time you improve a version, be sure to write in the README: “What new capability was added, how was it verified, and what problems still remain.”
Evidence to Keep
Section titled “Evidence to Keep”Keep this page’s proof of learning as a small evidence card:
- Project Goal
- prediction, segmentation, Kaggle, or end-to-end ML portfolio target
- Pipeline
- data split, preprocessing, model, evaluation, and report artifacts
- Result
- metric table, chart, predictions, failure samples, and README note
- Failure Check
- non-reproducible run, leakage, overfitting, weak baseline, or missing deployment boundary
- Expected Output
- ML project folder with pipeline, metrics, and failure review