
8.4.4 Logging and Monitoring
Learning objectives
Section titled “Learning objectives”- Understand what problems logs, metrics, and tracing each solve
- Learn how to design structured log fields
- Understand which metrics are most worth monitoring in an LLM system
- Read a minimal example of logs + monitoring
Beginner terminology bridge
Section titled “Beginner terminology bridge”Observability is easier if you separate these terms early:
| Term | What it answers | Example in an LLM app |
|---|---|---|
log | What happened at one moment? | Retrieval started, model call failed, export completed |
metric | What is the overall trend? | Error rate, P95 latency, average token cost |
trace | What path did one request follow? | API -> retrieval -> model -> template rendering -> response |
P95 / P99 | How slow are the slowest 5% or 1% of requests? | More useful than average latency when users complain about occasional slowness |
observability | Can we understand system behavior from the outside? | The combination of logs, metrics, traces, dashboards, and alerts |
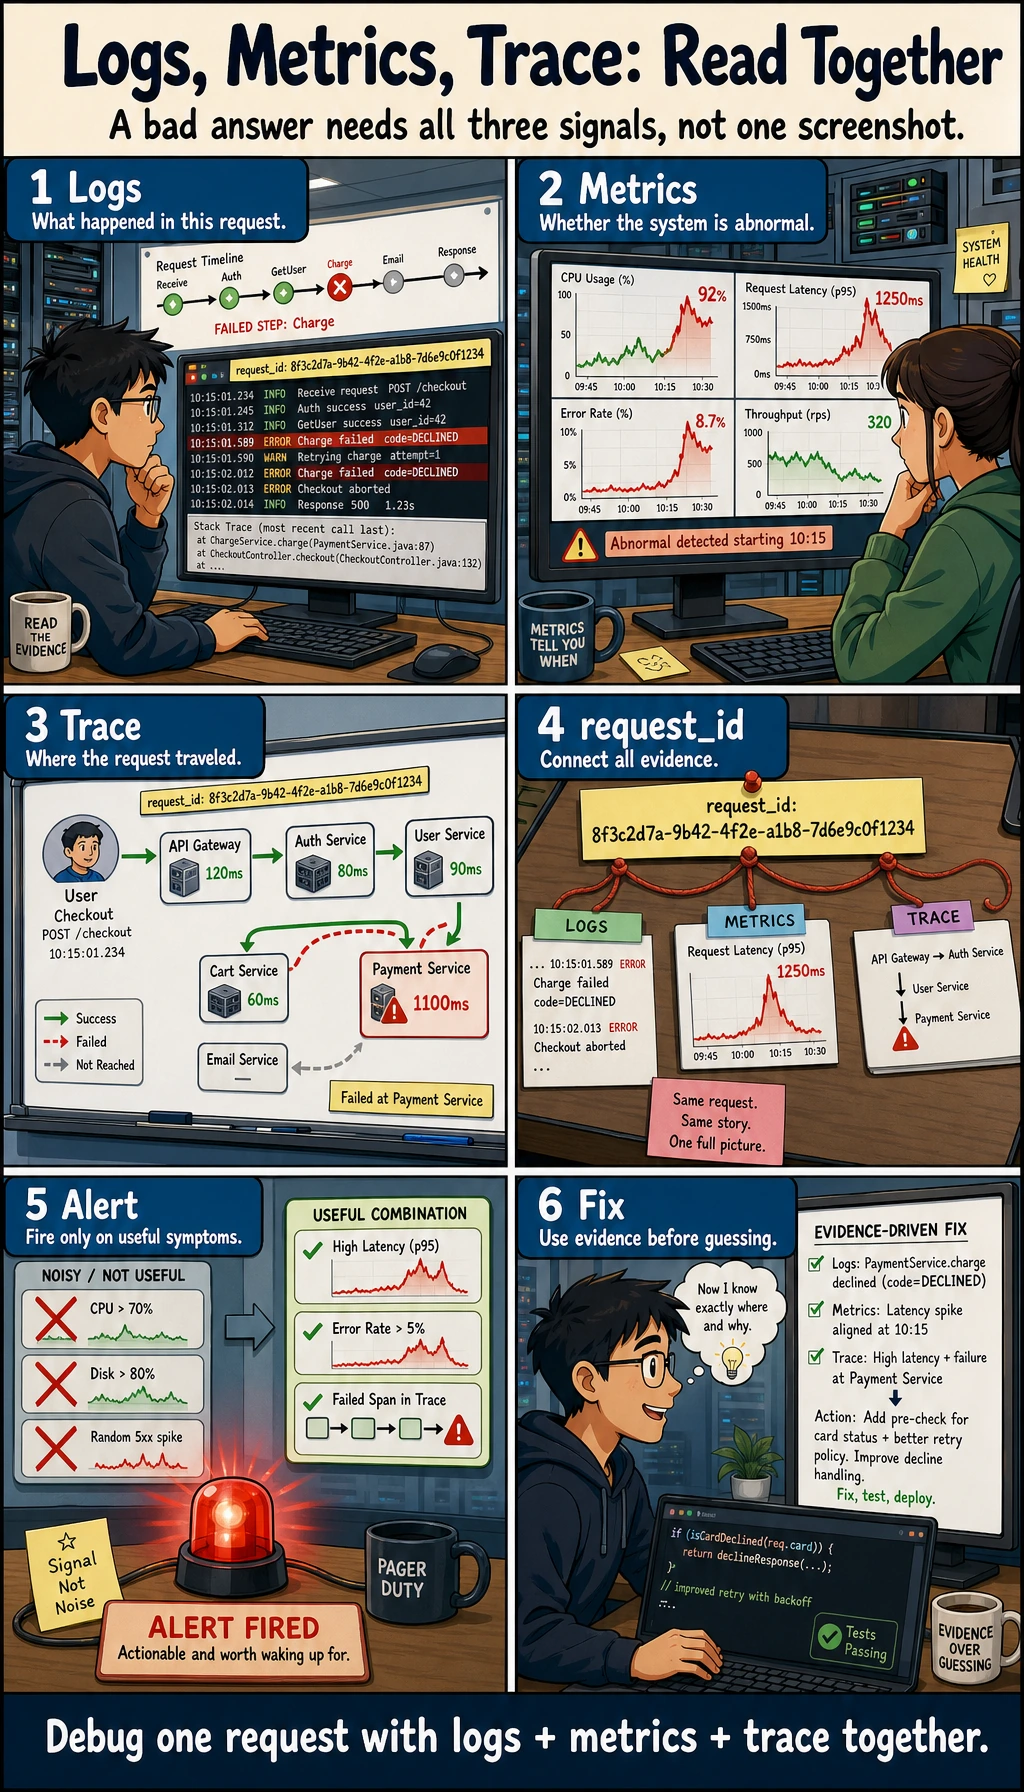
For beginners, the key distinction is: logs are individual events, metrics are aggregated numbers, and traces connect the steps of one request.
First, build a mental map
Section titled “First, build a mental map”Logging and monitoring are easier to understand as “what happened -> how is the system performing overall -> what did a single request go through”:
flowchart LR A["Logs"] --> B["Record single events"] B --> C["Metrics"] C --> D["See overall trends"] D --> E["Trace"] E --> F["Reconstruct a single request path"]So what this section really wants to solve is:
- When something goes wrong, which layer should you look at first?
- Why are logs, metrics, and traces all necessary for troubleshooting?
Why is this especially important?
Section titled “Why is this especially important?”Failures in LLM systems are more hidden than in normal APIs
Section titled “Failures in LLM systems are more hidden than in normal APIs”Errors in ordinary APIs are usually pretty direct:
- 500
- timeout
- invalid parameters
But LLM systems can also have these “soft failures”:
- Answer quality gets worse
- Retrieval drifts
- Token cost skyrockets
- Mistakes happen only in certain scenarios
So if you do not have observability, the system often becomes:
It looks alive, but in reality it is already half broken.
What do logging and monitoring actually solve?
Section titled “What do logging and monitoring actually solve?”A rough three-layer view is enough to start:
- Logs: what happened
- Metrics: how often, how fast, and how expensive it is
- Tracing: the full path a request took
A beginner-friendly analogy
Section titled “A beginner-friendly analogy”You can think of observability as:
- Installing a dashboard, a dashcam, and a maintenance log in the system
Without these, when the system breaks, all you can say is:
- Something feels off
With them, you can actually know:
- Where the problem started
- Whether it is occasional or continuous
- Whether it is a single-request issue or a system-wide issue
Start with logs: the most basic and most often misused tool
Section titled “Start with logs: the most basic and most often misused tool”What is a “structured log”?
Section titled “What is a “structured log”?”Instead of printing just a string:
print("request received")It is much more useful to record structured fields:
- request_id
- user_id
- stage
- latency_ms
- model_name
A minimal structured log example
Section titled “A minimal structured log example”log = { "trace_id": "trace_001", "stage": "retrieval", "query": "What is the refund policy?", "latency_ms": 120, "top_k": 3}
print(log)Expected output:
{'trace_id': 'trace_001', 'stage': 'retrieval', 'query': 'What is the refund policy?', 'latency_ms': 120, 'top_k': 3}The biggest advantage of this kind of log is:
Later, you can query and aggregate by field instead of reading text manually.
Metrics: the thermometer for overall system health
Section titled “Metrics: the thermometer for overall system health”The most important metrics to monitor
Section titled “The most important metrics to monitor”For LLM systems, the most common metrics include:
- Request volume
- Error rate
- Average latency
- P95 / P99 latency
- Token usage
- Number of tool calls
- Retrieval hit rate
A minimal metrics aggregation example
Section titled “A minimal metrics aggregation example”requests = [ {"latency_ms": 800, "tokens": 600, "ok": True}, {"latency_ms": 1200, "tokens": 750, "ok": True}, {"latency_ms": 3000, "tokens": 900, "ok": False}]
avg_latency = sum(r["latency_ms"] for r in requests) / len(requests)error_rate = sum(not r["ok"] for r in requests) / len(requests)avg_tokens = sum(r["tokens"] for r in requests) / len(requests)
print("avg_latency_ms =", avg_latency)print("error_rate =", error_rate)print("avg_tokens =", avg_tokens)Expected output:
avg_latency_ms = 1666.6666666666667error_rate = 0.3333333333333333avg_tokens = 750.0This is the smallest possible prototype of a monitoring dashboard.
A beginner-friendly metric table to remember first
Section titled “A beginner-friendly metric table to remember first”| Metric | What it helps answer |
|---|---|
| Request volume | Is the system busy? |
| Error rate | Does the system fail often? |
| Average / P95 latency | Are users waiting too long? |
| Token usage | Is the cost abnormal? |
| Retrieval hit rate | Is the RAG pipeline getting worse? |
| Tool call success rate | Is the Agent action layer stable? |
This table is useful for beginners because it turns “there are many metrics” back into a few understandable questions.
Tracing: what exactly did a request go through?
Section titled “Tracing: what exactly did a request go through?”Why do LLM systems especially need traces?
Section titled “Why do LLM systems especially need traces?”Because a single request usually does not go through just one module; it may pass through:
- API entry
- Retrieval
- Tool calls
- Model generation
- Post-processing
If the final answer is wrong, you need to know:
- Was retrieval wrong?
- Or was model generation wrong?
- Or did the tool layer fail?
A minimal trace example
Section titled “A minimal trace example”trace = [ {"trace_id": "trace_001", "stage": "api_in", "latency_ms": 20}, {"trace_id": "trace_001", "stage": "retrieval", "latency_ms": 120}, {"trace_id": "trace_001", "stage": "llm_generate", "latency_ms": 850}, {"trace_id": "trace_001", "stage": "response_out", "latency_ms": 15}]
for item in trace: print(item)Expected output:
{'trace_id': 'trace_001', 'stage': 'api_in', 'latency_ms': 20}{'trace_id': 'trace_001', 'stage': 'retrieval', 'latency_ms': 120}{'trace_id': 'trace_001', 'stage': 'llm_generate', 'latency_ms': 850}{'trace_id': 'trace_001', 'stage': 'response_out', 'latency_ms': 15}The core value of trace is:
It lets you see the complete journey of the same request.
The safest default order for your first production troubleshooting session
Section titled “The safest default order for your first production troubleshooting session”A more reliable order is usually:
- First check whether metrics show an overall anomaly
- Then look at logs to see which type of request is failing
- Finally follow the trace to inspect the full path
This is usually easier than opening a wall of logs right away.
A more realistic minimal observability loop
Section titled “A more realistic minimal observability loop”import time
def timed_stage(name, fn, *args, **kwargs): start = time.time() result = fn(*args, **kwargs) latency_ms = int((time.time() - start) * 1000) log = { "trace_id": "trace_demo_001", "stage": name, "latency_ms": latency_ms } print(log) return result
def fake_retrieve(query): time.sleep(0.1) return ["refund policy"]
def fake_llm(docs): time.sleep(0.2) return f"Generate an answer based on {docs}"
docs = timed_stage("retrieval", fake_retrieve, "What is the refund policy?")answer = timed_stage("llm_generate", fake_llm, docs)print(answer)Example output; the exact latency values may vary slightly:
{'trace_id': 'trace_demo_001', 'stage': 'retrieval', 'latency_ms': 100}{'trace_id': 'trace_demo_001', 'stage': 'llm_generate', 'latency_ms': 200}Generate an answer based on ['refund policy']Although this example is small, it already includes these core fields:
- trace_id
- stage
- latency
What else is worth monitoring in an LLM system?
Section titled “What else is worth monitoring in an LLM system?”Compared with a traditional API, an LLM system is usually worth monitoring for these additional things:
Token cost
Section titled “Token cost”Because it directly determines:
- How much money you spend
- Whether prompts are getting longer and longer
Retrieval quality
Section titled “Retrieval quality”For example:
- Whether top-1 is a hit
- The rate of empty retrieval results
Tool call quality
Section titled “Tool call quality”For example:
- Tool call success rate
- Parameter validation failure rate
- Retry rate
Answer quality signals
Section titled “Answer quality signals”For example:
- User follow-up rate
- User correction rate
- Thumbs-down rate
These metrics cannot replace offline evaluation, but they are still very important.
Why alerts should not only ask “is the service down?”
Section titled “Why alerts should not only ask “is the service down?””Many LLM issues do not directly cause a 500 error
Section titled “Many LLM issues do not directly cause a 500 error”For example:
- Answer quality keeps dropping
- Token usage suddenly doubles
- Retrieval hit rate falls sharply
The system may still be “alive,” but the business is already clearly broken.
So alerts are best split into two layers
Section titled “So alerts are best split into two layers”-
Basic availability alerts
- Error rate
- Timeout rate
-
Business quality alerts
- Retrieval hit rate drops
- Average token count rises abnormally
- User negative feedback increases abnormally
A beginner-friendly alert layering table
Section titled “A beginner-friendly alert layering table”| Alert type | Typical example |
|---|---|
| Availability alert | High error rate, high timeout rate |
| Cost alert | Token usage spikes, abnormal call volume |
| Quality alert | Retrieval hit rate drops, user follow-up rate rises |
This table is useful for beginners because it reminds you:
- An LLM system can “break” in more than one way
If your goal is a “SOP document assistant driven by a knowledge base,” what should you monitor first?
Section titled “If your goal is a “SOP document assistant driven by a knowledge base,” what should you monitor first?”This kind of system is more likely than ordinary Q&A to look “fine” while actually drifting off course.
When you build it for the first time, it is especially worth watching these fields:
| Monitoring point | What it is really checking |
|---|---|
retrieved_count | Whether policy, case, and checklist evidence was retrieved |
case_count | Whether handled case examples were attached |
policy_coverage | Whether required policy sections are present |
export_success | Whether Word export succeeded |
schema_valid | Whether the structured result matches the SOP template requirements |
A minimal log object can look like this:
log = {    "trace_id": "trace_001",    "topic": "refund escalation SOP",    "retrieved_count": 5,    "case_count": 2,    "policy_coverage": "complete",    "schema_valid": True,    "export_success": True,}
print(log)
Expected output:
{'trace_id': 'trace_001', 'topic': 'refund escalation SOP', 'retrieved_count': 5, 'case_count': 2, 'policy_coverage': 'complete', 'schema_valid': True, 'export_success': True}This example is especially good for beginners because it helps you understand:
- The monitoring focus of this kind of project is not just whether the model is fast
- It also includes whether the right evidence was found, whether the SOP sections took shape, and whether the document was exported successfully
A very practical checklist of log fields
Section titled “A very practical checklist of log fields”If you are building an LLM service, the most practical set of fields usually includes:
| Field | Purpose |
|---|---|
| trace_id | Connect the whole request path |
| user_id / session_id | Identify the user or session |
| stage | Which step it is in |
| latency_ms | How long this step took |
| model_name | Which model was used |
| prompt_tokens / completion_tokens | Cost analysis |
| tool_name | Which tool was called |
| retrieval_topk | Retrieval settings |
| error_code | Failure type |
Not every log needs all of these, but this list is a very good starting point for design.
Common mistakes beginners make
Section titled “Common mistakes beginners make”Only logging strings, not fields
Section titled “Only logging strings, not fields”That makes later aggregation and analysis difficult.
Only logging successes, not failures
Section titled “Only logging successes, not failures”This makes error diagnosis very painful.
No trace_id
Section titled “No trace_id”When something goes wrong, you cannot reconstruct the full request path.
Monitoring only availability, not business quality
Section titled “Monitoring only availability, not business quality”This is a very common problem in LLM projects.
Evidence to Keep
Section titled “Evidence to Keep”Keep this page’s proof of learning as a small evidence card:
- Service Contract
- endpoint, input schema, output schema, error schema
- Run Signal
- latency, throughput, logs, health check, or container status
- Observability
- request id, trace id, structured log, or metric
- Failure Check
- timeout, retry storm, missing log, deployment mismatch
- Ops Action
- backoff, queue, alert, rollout, or rollback
Summary
Section titled “Summary”The most important thing in this section is not “learning how to write logs,” but understanding:
Logs, metrics, and traces together form system observability, and they determine whether you can truly maintain a production LLM service.
Without observability, many failures can only be guessed at; with observability, the system becomes maintainable.
If you turn this into a project or system design, what is most worth showing?
Section titled “If you turn this into a project or system design, what is most worth showing?”What is most worth showing is usually not:
- “I connected a logging system”
But rather:
- A trace for a single request
- A set of key metrics
- How a typical error case was located
- How quality alerts and availability alerts are layered
That way, other people can more easily see:
- You understand the full observability loop
- You are not just able to print logs
Exercises
Section titled “Exercises”- Add an
error_codefield totimed_stage()in this section. - Design your own log structure specifically for the retrieval stage.
- Think about this: if the service error rate does not change, but the user follow-up rate suddenly increases, what does that usually mean?
- Explain in your own words: why can’t LLM system alerts rely only on 500 errors and timeouts?
Reference implementation and walkthrough
error_codehelps group failures beyond raw message strings.- A retrieval log should include
trace_id, query, rewritten query, filters,top_k, candidate IDs, scores, selected citations, latency, and user role/permission outcome. - More follow-up questions can mean the answer is unclear, missing citations, low confidence, or did not complete the user task even though the system did not error.
- LLM failures include bad retrieval, hallucination, policy mistakes, tool misuse, high cost, and poor satisfaction. 500 errors and timeouts miss many of these.