
3.3.1 Pandas Roadmap: From Raw Table to Analysis Table
Pandas is the table workstation of this course. Use it when a plain CSV, Excel file, log table, or SQL query result must become clean enough for charts, machine learning, RAG evaluation, or reports.
Look at the Workflow First
Section titled “Look at the Workflow First”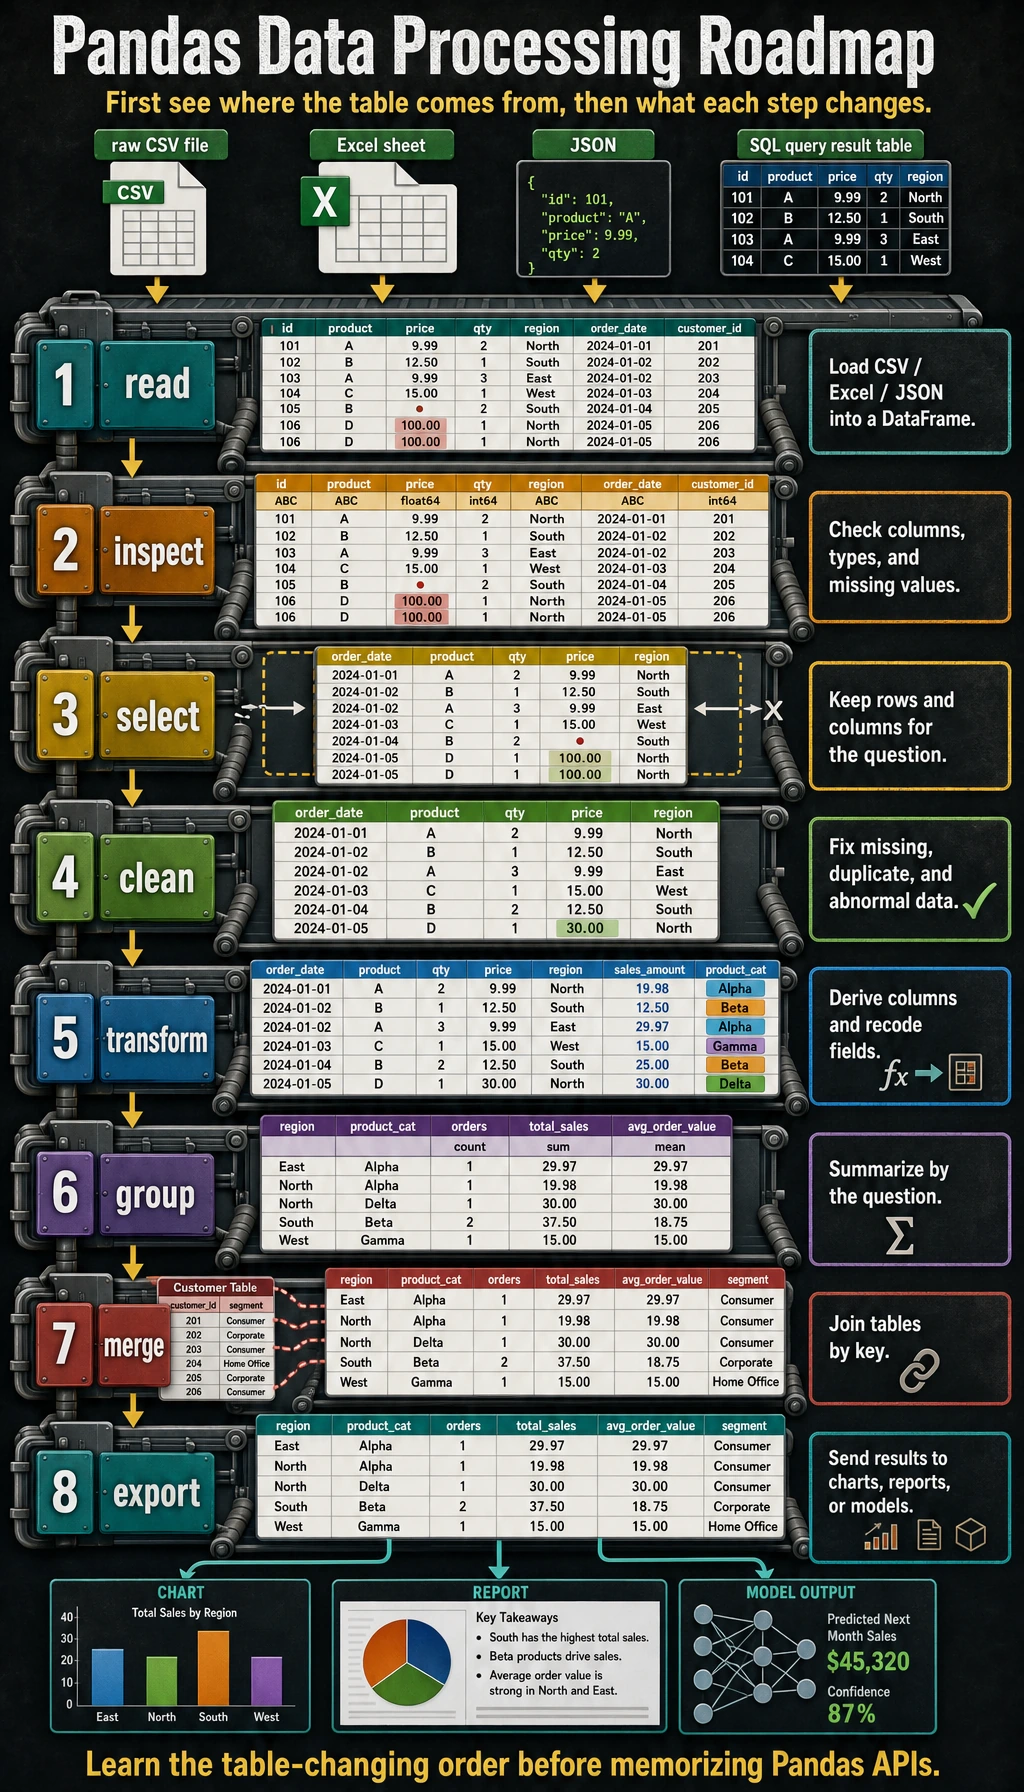
Keep this one-line flow in mind:
Do not memorize every API first. Ask: what table do I have, what table do I need, and which step changes one into the other?
Run a Tiny Table Once
Section titled “Run a Tiny Table Once”Create pandas_first_loop.py and run it after installing pandas.
import pandas as pd
orders = pd.DataFrame(    [        {"date": "2026-05-01", "category": "book", "amount": 120},        {"date": "2026-05-02", "category": "tool", "amount": 80},        {"date": "2026-05-03", "category": "book", "amount": None},        {"date": "2026-06-01", "category": "book", "amount": 150},    ])
clean = (    orders.dropna(subset=["amount"])    .assign(month=lambda df: pd.to_datetime(df["date"]).dt.to_period("M").astype(str)))summary = clean.groupby(["month", "category"], as_index=False)["amount"].sum()
print(summary)
Expected output shape:
month category amount0 2026-05 book 120.01 2026-05 tool 80.02 2026-06 book 150.0You just did the core Pandas loop: create/read data, clean missing values, add a derived column, group, and summarize.
Learn in This Order
Section titled “Learn in This Order”| Order | Read | What to practice |
|---|---|---|
| 1 | 3.3.2 Core Data Structures | Series, DataFrame, Index |
| 2 | 3.3.3 Data Reading and Writing | CSV, Excel, JSON, export |
| 3 | 3.3.4 Selection and Filtering | loc, iloc, conditions |
| 4 | 3.3.5 Data Cleaning | missing values, duplicates, types |
| 5 | 3.3.6 Data Transformation | new columns, mapping, string/date handling |
| 6 | 3.3.7 Grouping and Aggregation | groupby, metrics, category/month summaries |
| 7 | 3.3.8 Data Merging | join multiple tables safely |
| 8 | 3.3.9 Time Series | date index, resampling, time windows |
Evidence to Keep
Section titled “Evidence to Keep”Keep this page’s proof of learning as a small evidence card:
- Dataframe State
- columns, dtypes, row count, missing values, and sample rows
- Operation
- read/write, select/filter, clean, transform, groupby, merge, or time-series step
- Output
- resulting table, saved file, aggregation, join result, or time index view
- Failure Check
- dtype mismatch, missing data, duplicated keys, chained assignment, or wrong time frequency
- Expected Output
- before/after table sample with the transformation reason
Pass Check
Section titled “Pass Check”You pass this subchapter when you can turn one raw table into one clean summary table, explain each column change, and save the result for visualization or machine learning.
Check reasoning and explanation
- A passing answer starts from the question, identifies the table/DataFrame or query needed, and keeps the cleaning step reproducible.
- The evidence should include a small output sample, a plot or SQL result when relevant, and one sentence interpreting what changed.
- A good self-check names one data-quality risk such as missing values, duplicate rows, wrong joins, misleading aggregation, or an unreadable chart.