
4.2.1 Probability Roadmap: Give AI a Language for Uncertainty
Probability and statistics explain why models output confidence, why data varies, and why training uses loss values instead of only right/wrong labels.
Look at the Map First
Section titled “Look at the Map First”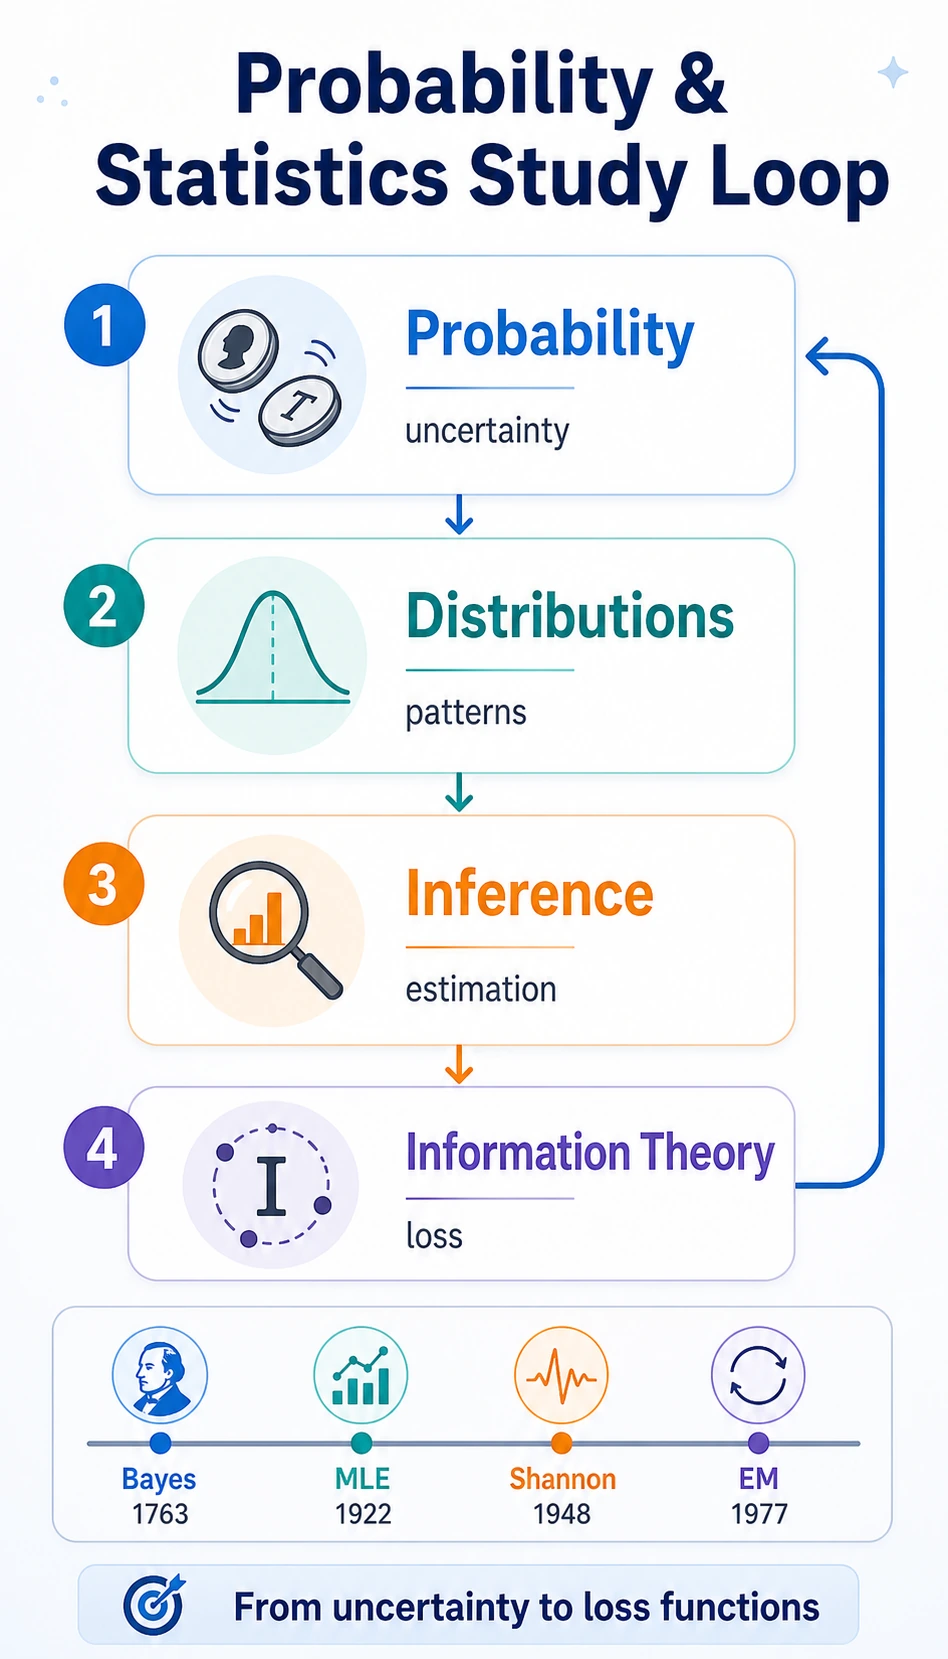
The chapter flow is:
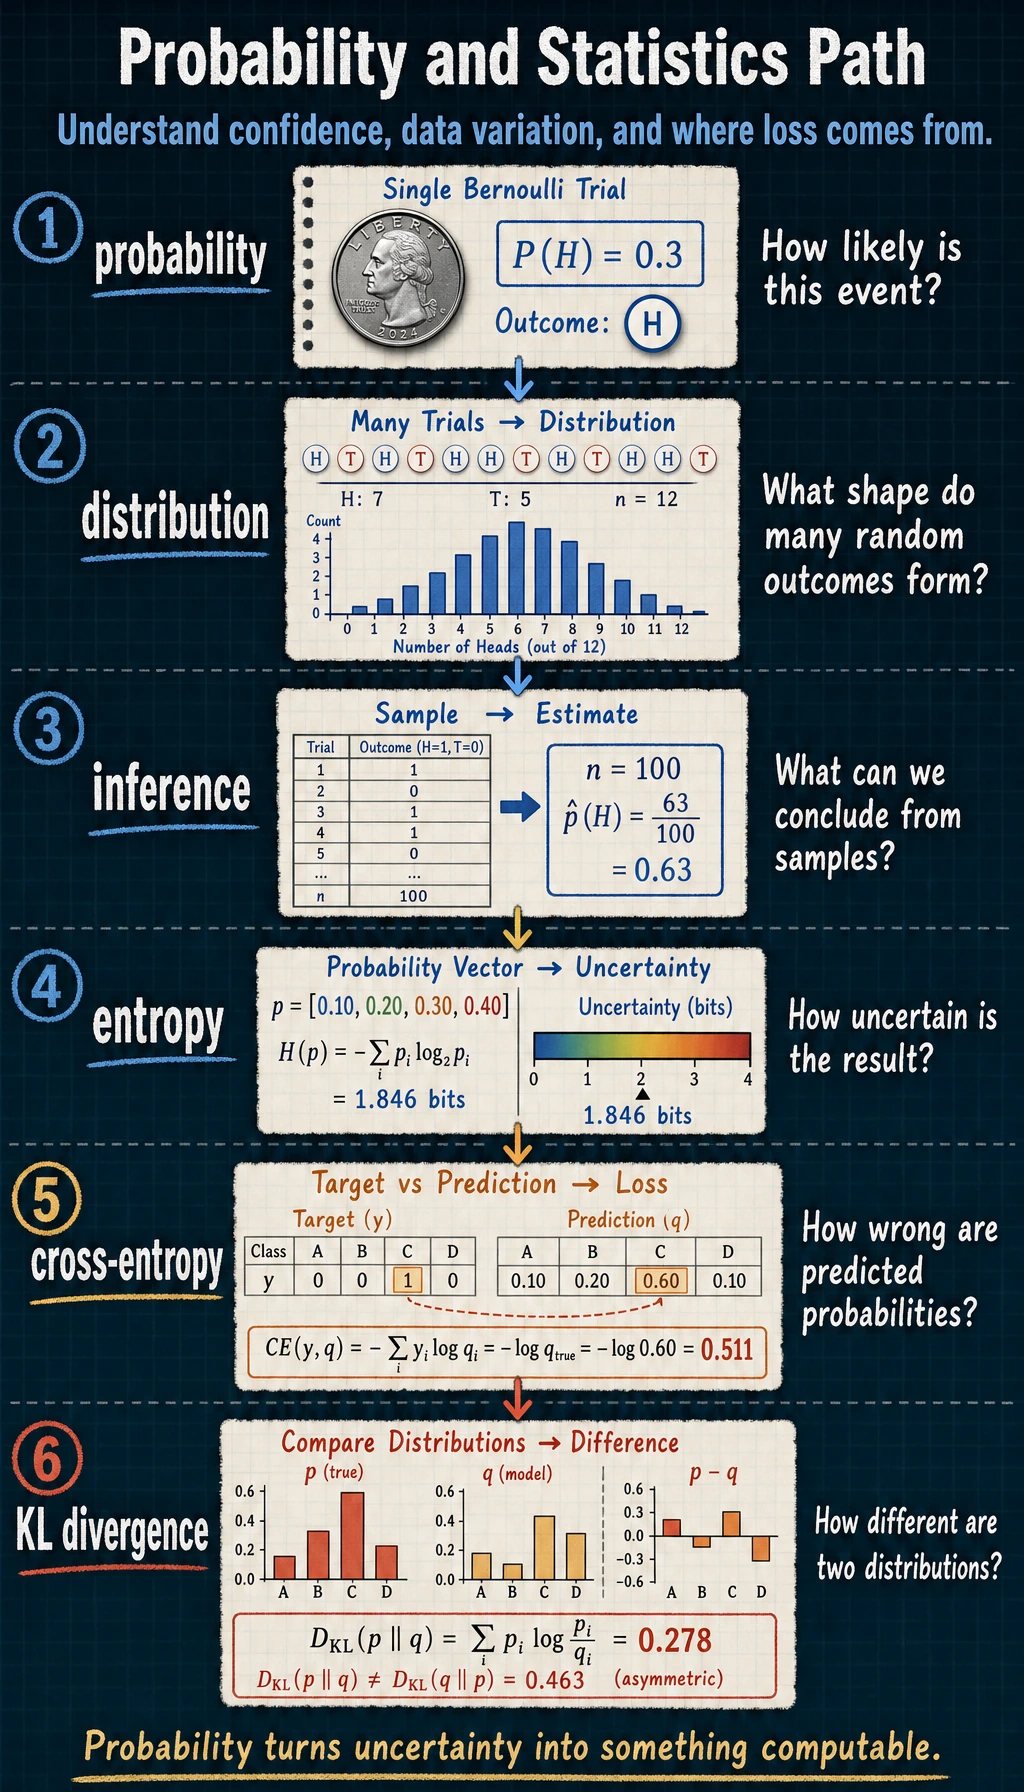
| Term | First question to ask |
|---|---|
| probability | how likely is this event? |
| distribution | what shape do many random outcomes form? |
| inference | what can we conclude after seeing data? |
| entropy | how uncertain is the result? |
| cross-entropy | how wrong is the predicted probability distribution? |
| KL divergence | how different are two distributions? |
Run the Smallest Loop
Section titled “Run the Smallest Loop”Create probability_first_loop.py. It uses only the Python standard library.
import math
labels = [1, 0, 1, 1]predicted_probs = [0.9, 0.2, 0.6, 0.8]
losses = []for y, p in zip(labels, predicted_probs):    loss = -(y * math.log(p) + (1 - y) * math.log(1 - p))    losses.append(loss)
cross_entropy = sum(losses) / len(losses)print("cross_entropy:", round(cross_entropy, 3))print("predicted_probs:", predicted_probs)
Expected output:
cross_entropy: 0.266predicted_probs: [0.9, 0.2, 0.6, 0.8]Lower cross-entropy means the probabilities are closer to the labels. This is why probability is directly connected to model training.
Learn in This Order
Section titled “Learn in This Order”| Order | Read | What to focus on first |
|---|---|---|
| 1 | 4.2.2 Probability Basics | event, conditional probability, Bayes update |
| 2 | 4.2.3 Distributions | Bernoulli, binomial, normal distribution |
| 3 | 4.2.4 Statistical Inference | MLE, MAP, confidence, A/B testing |
| 4 | 4.2.5 Information Theory | entropy, cross-entropy, KL divergence |
| 5 | 4.2.6 Historical Foundations | Bayes, Fisher, Shannon, EM in context |
Evidence to Keep
Section titled “Evidence to Keep”Keep this page’s proof of learning as a small evidence card:
- Random Process
- event, distribution, sample, likelihood, entropy, or Bayes update
- Simulation Or Formula
- code or formula used to make uncertainty visible
- Output
- probability, sample statistic, interval, entropy, or updated belief
- Failure Check
- base-rate confusion, p-value misuse, sample bias, or mixing probability with certainty
- Expected Output
- numeric result plus interpretation in plain language
Pass Check
Section titled “Pass Check”You pass this roadmap when you can say what uncertainty a probability term is measuring, and explain why a classifier output such as 0.93 is useful but not an absolute truth.
Check reasoning and explanation
- The probability route is passed when you can move from a single event to a repeated-sample estimate, then to a conditional update.
- Keep evidence for a simulation, a distribution plot, one MLE/MAP estimate, and one entropy or cross-entropy calculation.
- The key habit is to name the assumption: prior rate, independence, sample size, null hypothesis, or predicted probability.