
5.4.4 Bias-Variance Tradeoff
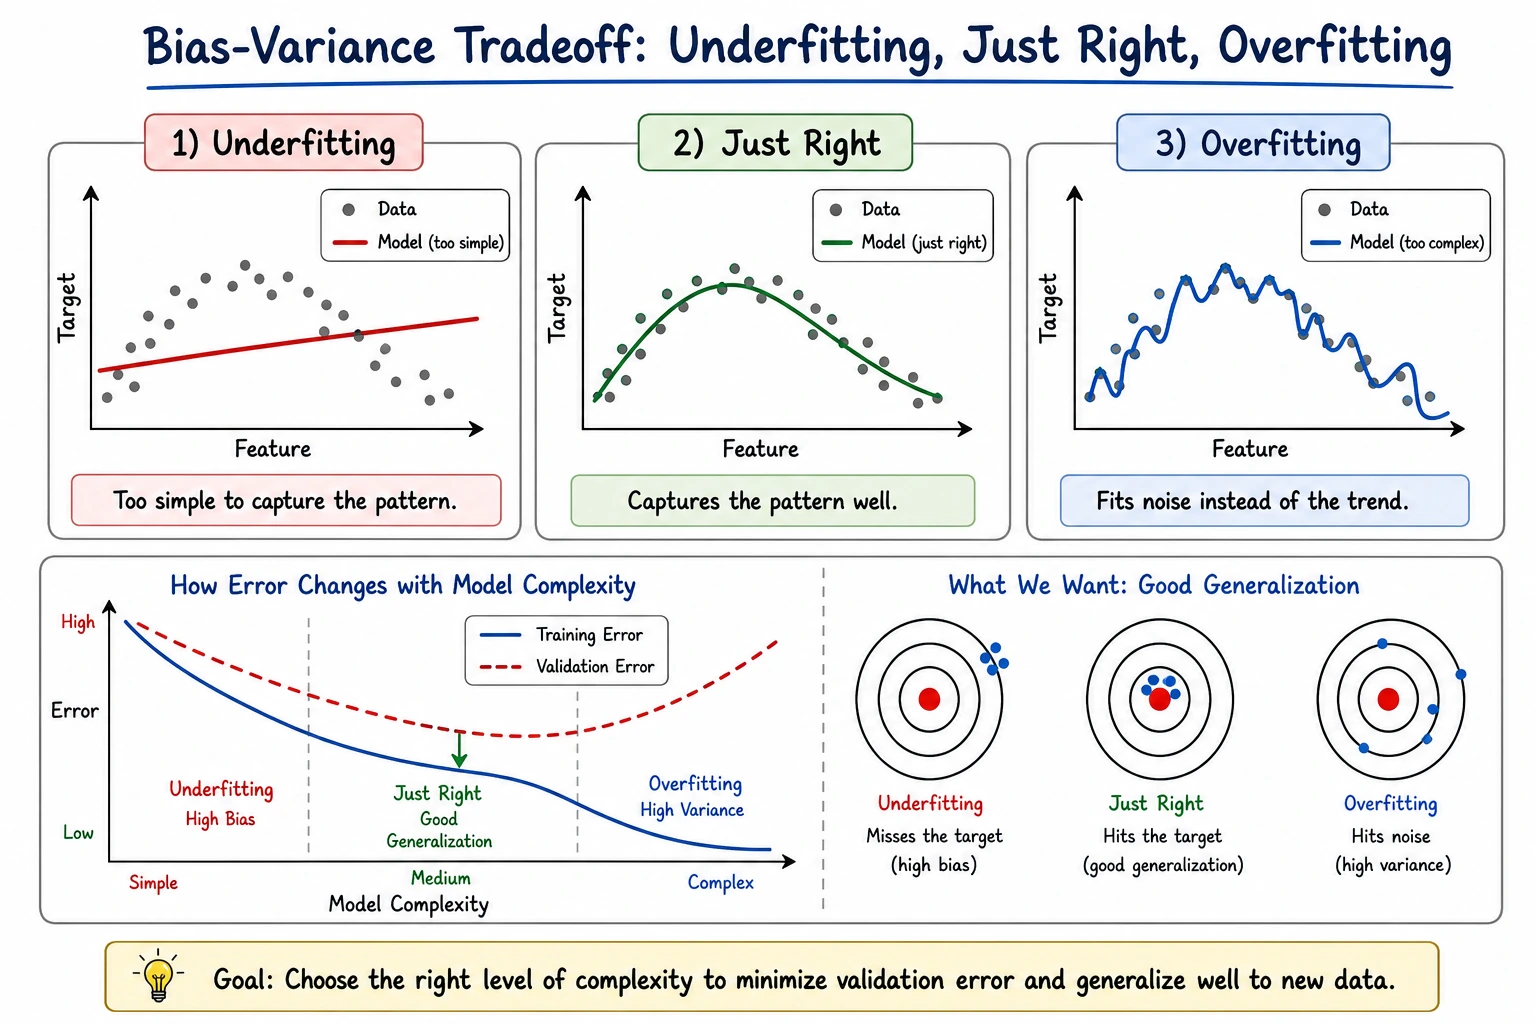
What You Will Build
Section titled “What You Will Build”This lesson uses decision trees to show:
- how model complexity changes train and test scores;
- how to identify underfitting and overfitting from the train-test gap;
- how learning curves show whether more data may help;
- what action to take for high bias vs high variance.
python -m pip install -U scikit-learn numpyRun the Complete Lab
Section titled “Run the Complete Lab”Create bias_variance_lab.py:
import numpy as npfrom sklearn.datasets import load_breast_cancerfrom sklearn.metrics import accuracy_scorefrom sklearn.model_selection import learning_curve, train_test_splitfrom sklearn.tree import DecisionTreeClassifier

X, y = load_breast_cancer(return_X_y=True)X_train, X_test, y_train, y_test = train_test_split(    X, y, test_size=0.25, random_state=42, stratify=y)
print("complexity_lab")for depth in [1, 3, 5, None]:    model = DecisionTreeClassifier(max_depth=depth, random_state=42)    model.fit(X_train, y_train)    train_acc = accuracy_score(y_train, model.predict(X_train))    test_acc = accuracy_score(y_test, model.predict(X_test))    gap = train_acc - test_acc    print(        f"max_depth={str(depth):<4} "        f"train={train_acc:.3f} test={test_acc:.3f} gap={gap:.3f} "        f"leaves={model.get_n_leaves()}"    )
print("learning_curve_lab")model = DecisionTreeClassifier(max_depth=3, random_state=42)train_sizes, train_scores, val_scores = learning_curve(    model,    X,    y,    cv=5,    train_sizes=[0.2, 0.4, 0.6, 0.8, 1.0],    scoring="accuracy",)for size, train_mean, val_mean in zip(train_sizes, train_scores.mean(axis=1), val_scores.mean(axis=1)):    print(f"train_size={size:<3} train={train_mean:.3f} cv={val_mean:.3f} gap={train_mean - val_mean:.3f}")
Run it:
python bias_variance_lab.pyExpected output:
complexity_labmax_depth=1 train=0.923 test=0.923 gap=-0.001 leaves=2max_depth=3 train=0.977 test=0.944 gap=0.032 leaves=7max_depth=5 train=0.995 test=0.937 gap=0.058 leaves=15max_depth=None train=1.000 test=0.923 gap=0.077 leaves=18learning_curve_labtrain_size=91 train=0.989 cv=0.847 gap=0.142train_size=182 train=0.986 cv=0.870 gap=0.116train_size=273 train=0.978 cv=0.903 gap=0.075train_size=364 train=0.975 cv=0.917 gap=0.057train_size=455 train=0.974 cv=0.919 gap=0.055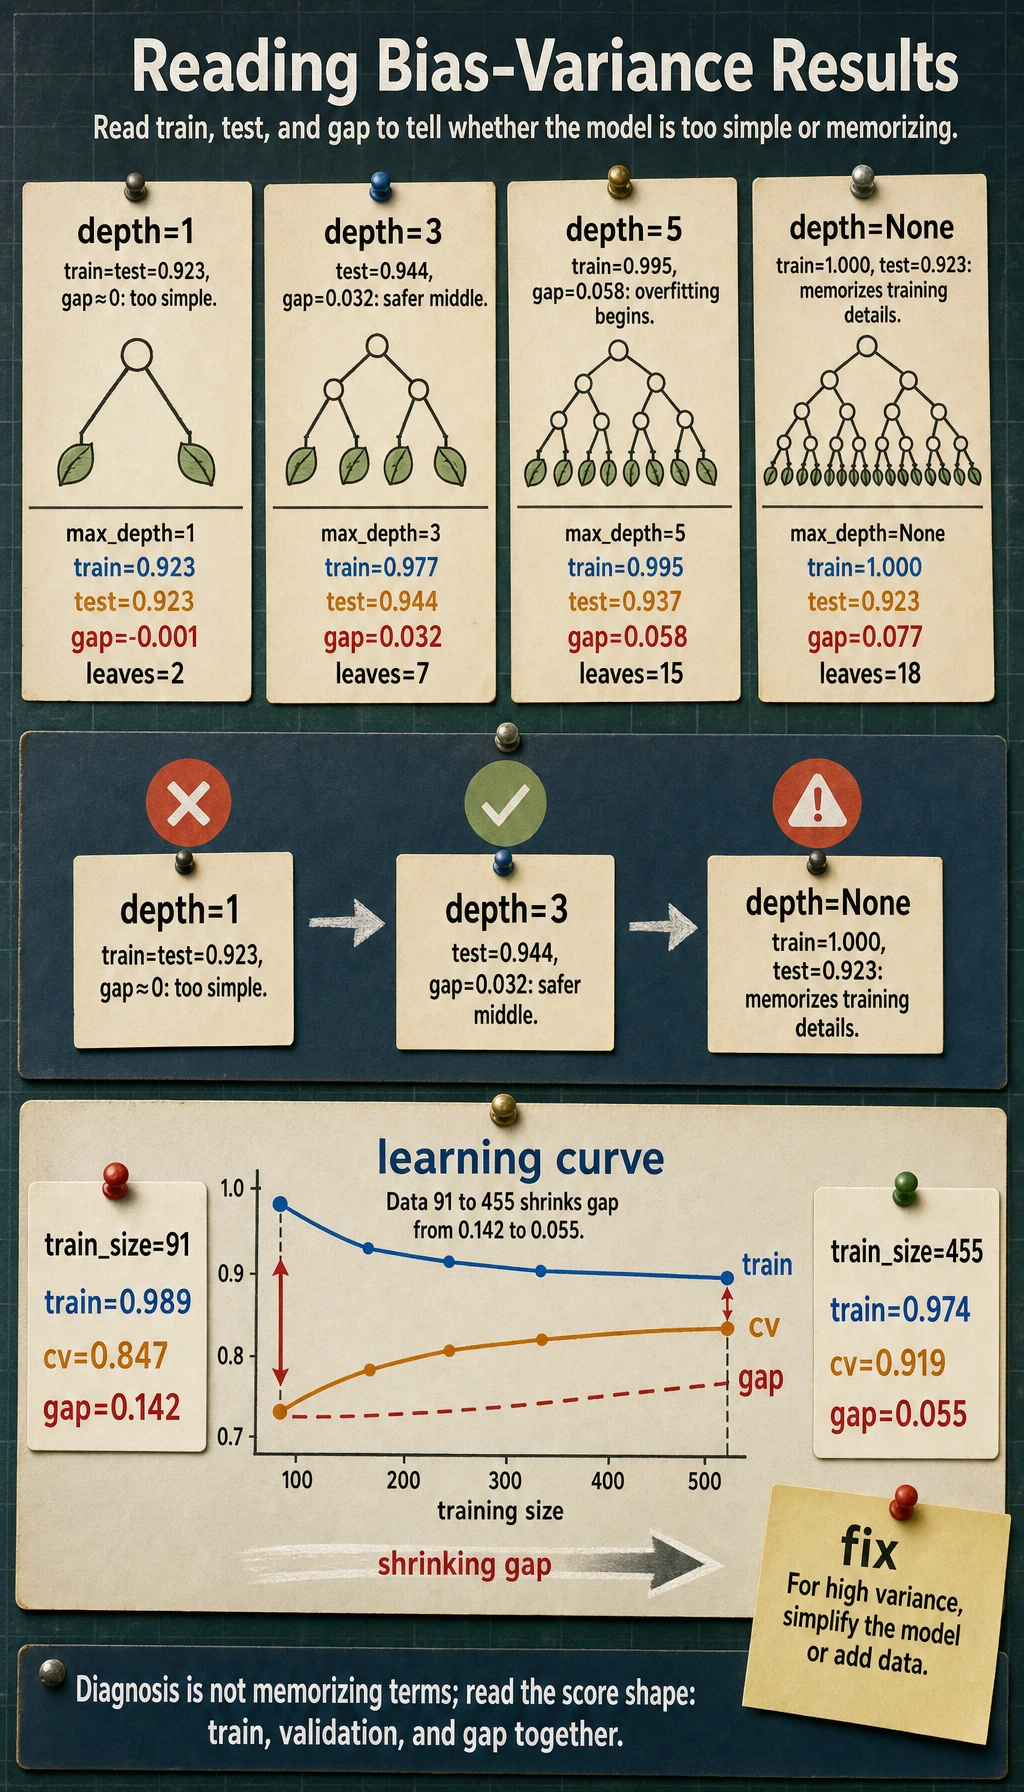
Read the Complexity Lab
Section titled “Read the Complexity Lab”The tree becomes more complex as max_depth grows:
max_depth=1 train=0.923 test=0.923 gap=-0.001 leaves=2max_depth=None train=1.000 test=0.923 gap=0.077 leaves=18max_depth=1 is simple. Train and test are similar, but the score is not the best. This can be high bias: the model may be too simple.
max_depth=None memorizes training data perfectly, but test accuracy drops. This is high variance: the model fits training details that do not generalize.
The best practical model is often in the middle:
max_depth=3 train=0.977 test=0.944 gap=0.032It is not perfect on training data, but it generalizes better.
Learning Curves
Section titled “Learning Curves”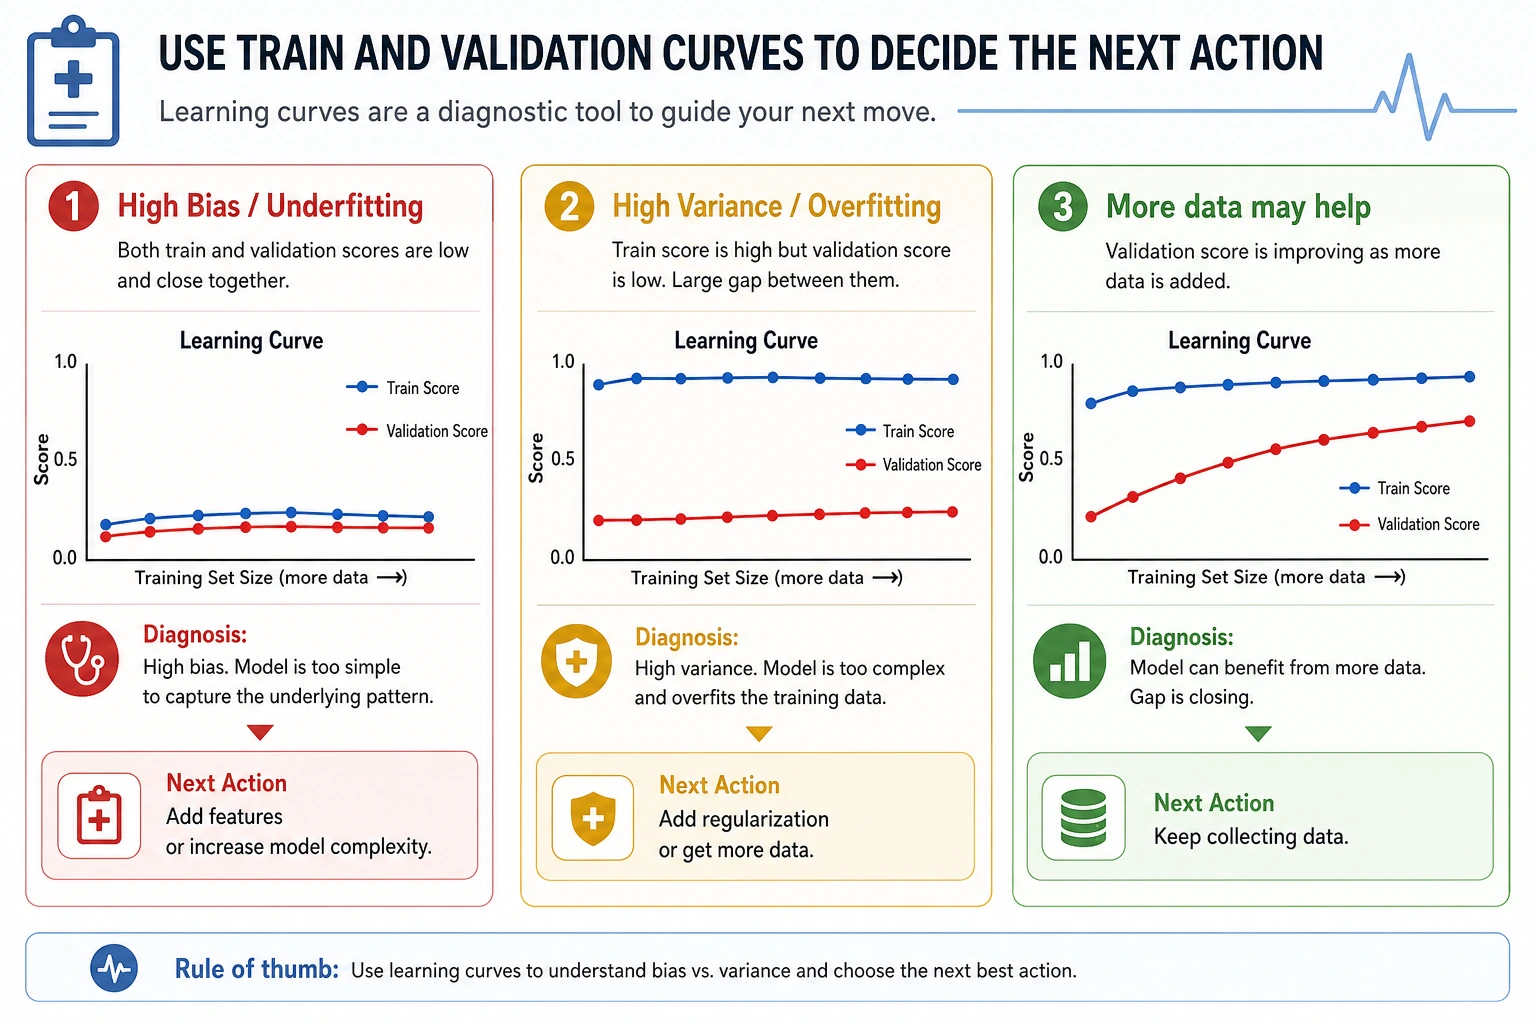
The learning curve shows what happens when more training data is used:
train_size=91 train=0.989 cv=0.847 gap=0.142train_size=455 train=0.974 cv=0.919 gap=0.055As data grows, validation score improves and the gap shrinks. That suggests more data may help, but the model still has room for better features or tuning.
Diagnosis Rules
Section titled “Diagnosis Rules”| Pattern | Likely problem | Try |
|---|---|---|
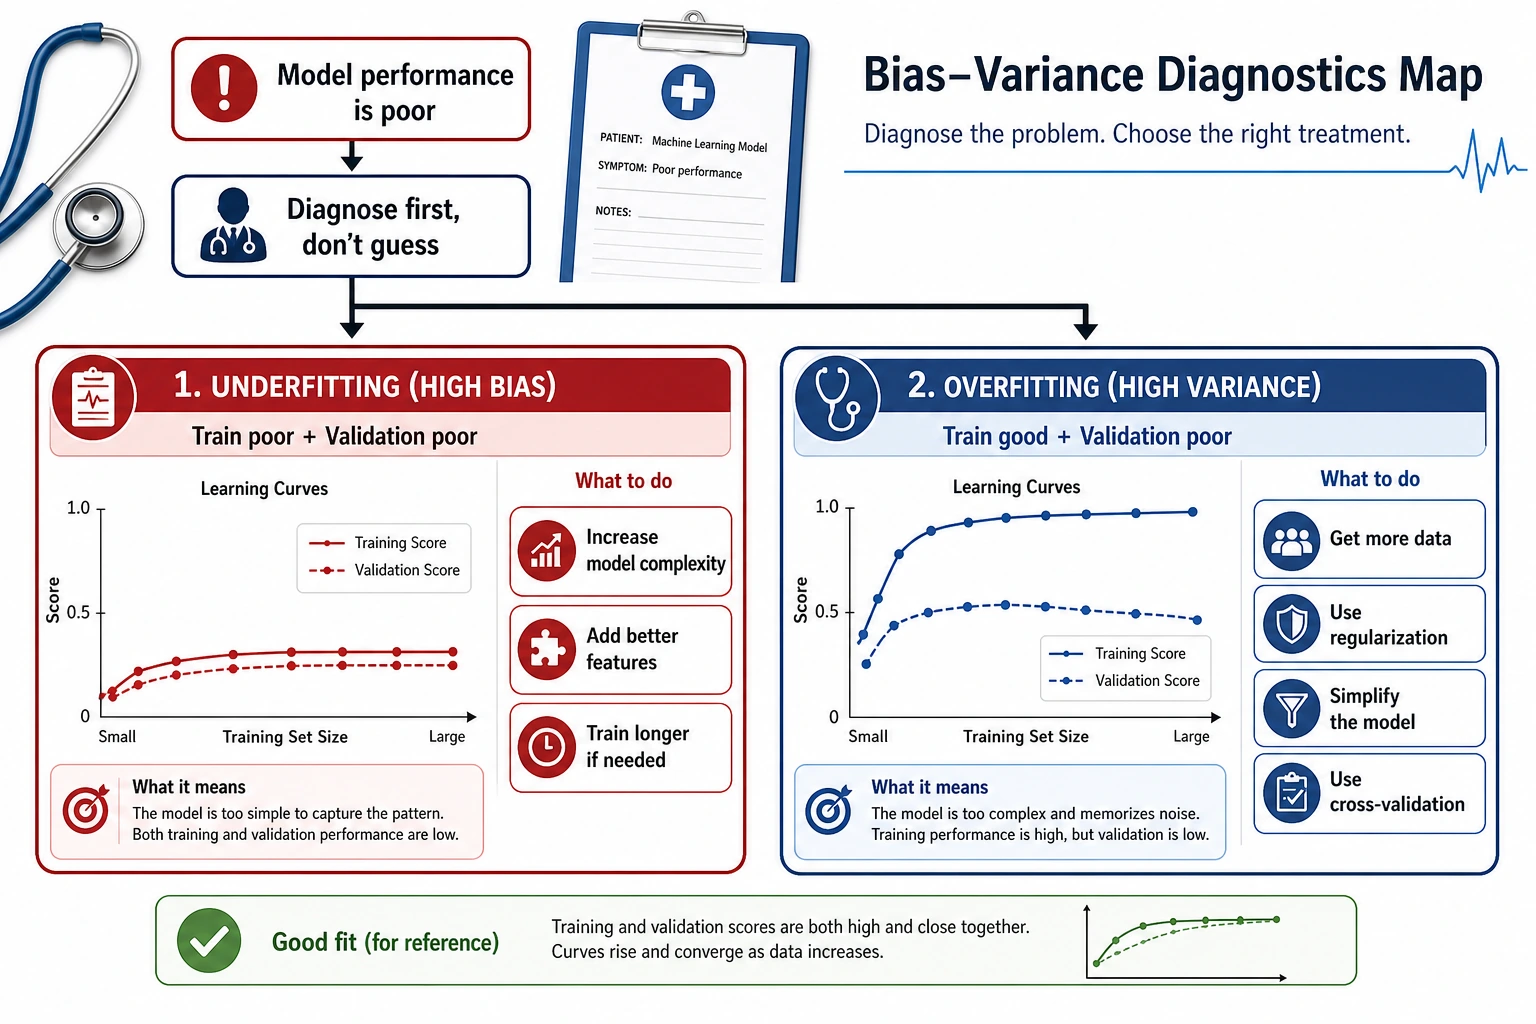
| train low, validation low | high bias / underfitting | richer model, better features, less regularization |
| train high, validation low | high variance / overfitting | simpler model, more regularization, more data |
| train high, validation high | good fit | test on final holdout and monitor drift |
| validation varies a lot by fold | instability or data segments | inspect folds, add data, use robust models |
Do not diagnose from one metric alone. Check train score, validation score, gap, and whether the mistakes are concentrated in a segment.
Practical Fixes
Section titled “Practical Fixes”For high bias:
- add useful features;
- use a more expressive model;
- reduce overly strong regularization;
- train longer if the model is iterative.
For high variance:
- reduce model complexity;
- increase regularization;
- collect more diverse data;
- use cross-validation and a final holdout;
- consider ensembles that reduce variance.
Practical Debugging Checklist
Section titled “Practical Debugging Checklist”| Symptom | Likely cause | Fix |
|---|---|---|
| Both train and validation are poor | model cannot express the pattern | improve features or model class |
| Train is perfect, validation is worse | overfitting | limit depth, prune, regularize |
| More data improves validation | variance or data scarcity | collect more representative data |
| More data does not help | high bias or noisy labels | improve features, labels, or model |
| Validation score jumps by fold | data is uneven | inspect segment distribution |
Practice
Section titled “Practice”- Add
min_samples_leaf=5to the tree. How does the gap change? - Try
max_depth=2, 4, 6, 8. Where does test accuracy peak? - Replace the tree with logistic regression. Is the issue bias or variance?
- Use 5-fold cross-validation instead of one test split for the complexity lab.
- Inspect mistakes for the best tree. Are errors concentrated in one class?
Reference implementation and walkthrough
min_samples_leaf=5usually narrows the train/test gap because the tree cannot memorize tiny leaves as easily. If both scores fall, the model may now be too simple.- Test accuracy often peaks at a middle depth. Very shallow trees underfit; very deep trees overfit even when training accuracy keeps rising.
- Logistic regression is a useful bias check. If it performs similarly and both models score low, features or model class may be too weak; if the tree trains much better but tests worse, variance is the main issue.
- Five-fold CV gives a more stable complexity comparison than one lucky split. Choose the depth with the best mean score and acceptable variance.
- Concentrated errors suggest a class-specific feature gap, label ambiguity, or imbalance problem. Randomly scattered errors suggest the remaining noise may be harder to remove.
Evidence to Keep
Section titled “Evidence to Keep”Keep this page’s proof of learning as a small evidence card:
- Evaluation Setup
- split, cross-validation, metric, baseline, and comparison target
- Result
- score table, curve, confusion matrix, validation result, or search outcome
- Decision
- whether to change data, features, model, threshold, or hyperparameters
- Failure Check
- leakage, unstable validation, wrong metric, or tuning on the test set
- Expected Output
- evaluation record that supports a next modeling decision
Pass Check
Section titled “Pass Check”You are done when you can explain:
- high bias means the model is too simple or missing signal;
- high variance means the model is too sensitive to training details;
- the train-validation gap is a practical diagnostic;
- learning curves show whether more data may help;
- the fix depends on the pattern, not the vocabulary.