
6.7.3 Training Monitoring and Diagnosis
Learning Objectives
Section titled “Learning Objectives”- Classify underfitting, overfitting, and unstable training from curves.
- Inspect prediction distribution and gradient norm.
- Use a repeatable troubleshooting order.
- Decide one next experiment from evidence.
- Know what to save in every training run.
Look at the Curves First
Section titled “Look at the Curves First”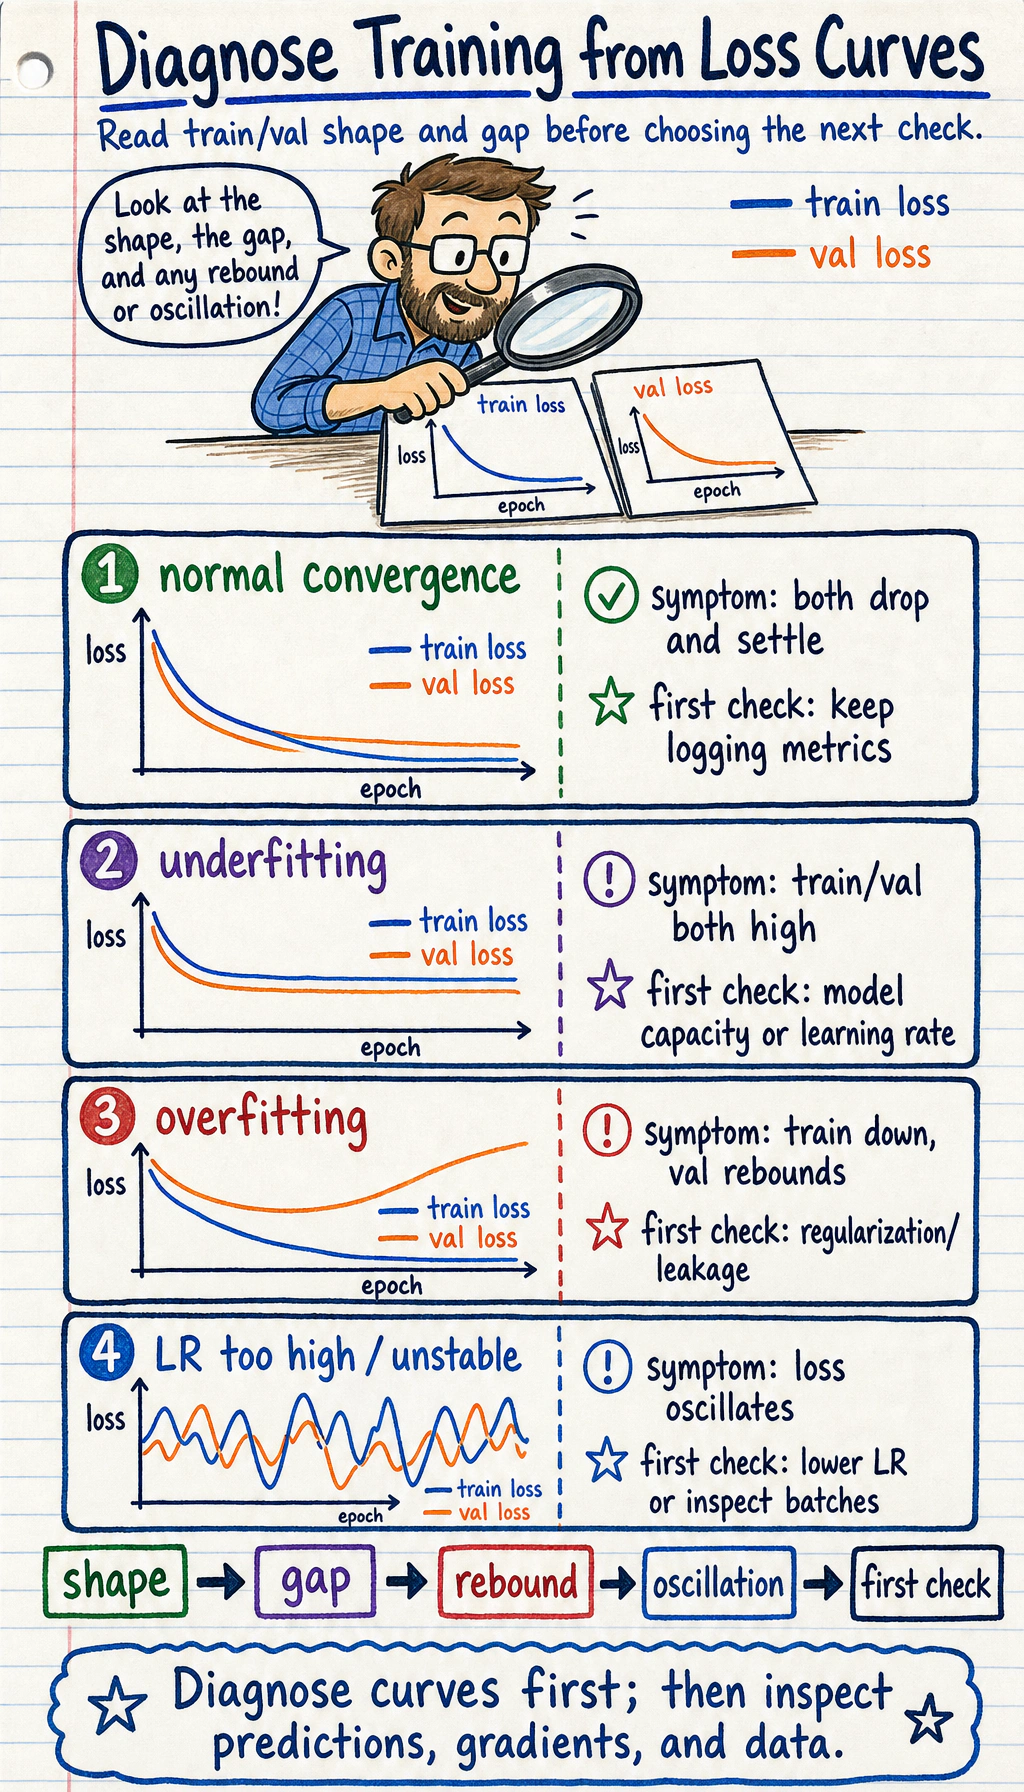
The first question is not “which model should I switch to?” It is:
what symptom is visible in the training evidence?| Symptom | Likely direction | First check |
|---|---|---|
| train and val both bad | underfitting | learning rate, model capacity, data quality |
| train improves but val worsens | overfitting | regularization, data split, augmentation |
| loss jumps up and down | instability | learning rate, batch size, gradients |
| predictions mostly one class | collapse or data issue | labels, class balance, output layer |
| metrics suddenly change | pipeline bug or distribution shift | data loader, preprocessing, validation split |
Lab 1: Classify Curve Patterns
Section titled “Lab 1: Classify Curve Patterns”histories = { "underfit_case": ([1.20, 1.08, 0.99, 0.94], [1.25, 1.13, 1.04, 1.02]), "overfit_case": ([0.90, 0.55, 0.31, 0.18], [0.92, 0.63, 0.68, 0.82]), "unstable_case": ([0.80, 1.65, 0.72, 1.48], [0.85, 1.70, 0.79, 1.55]),}
def diagnose(train, val): train_drop = train[0] - train[-1] val_best = min(val)
if max(train) - min(train) > 0.8: return "possible_lr_too_high_or_unstable_batches" if train[-1] > 0.8 and val[-1] > 0.8: return "possible_underfitting" if train_drop > 0.3 and val[-1] > val_best + 0.1: return "possible_overfitting" return "need_more_signals"
print("curve_diagnosis")for name, (train, val) in histories.items(): print(name, "->", diagnose(train, val))Expected output:
curve_diagnosisunderfit_case -> possible_underfittingoverfit_case -> possible_overfittingunstable_case -> possible_lr_too_high_or_unstable_batchesThis code is not a replacement for judgment. It teaches the first habit: classify the visible symptom before changing the system.
Lab 2: Check Gradients and Prediction Distribution
Section titled “Lab 2: Check Gradients and Prediction Distribution”Loss alone is not enough. A model can have a reasonable loss while predicting the same class for every sample.
import torchfrom torch import nn
torch.manual_seed(5)
X = torch.randn(12, 3)y = torch.tensor([0, 1, 0, 1, 1, 0, 0, 1, 0, 1, 1, 0])
model = nn.Sequential(nn.Linear(3, 4), nn.ReLU(), nn.Linear(4, 2))loss_fn = nn.CrossEntropyLoss()
logits = model(X)loss = loss_fn(logits, y)loss.backward()
grad_norm = 0.0for p in model.parameters():    if p.grad is not None:        grad_norm += p.grad.pow(2).sum().item()grad_norm = grad_norm**0.5
preds = logits.argmax(dim=1)counts = torch.bincount(preds, minlength=2)confidence = torch.softmax(logits, dim=1).max(dim=1).values.mean().item()
print("training_signals")print("loss:", round(loss.item(), 3))print("grad_norm:", round(grad_norm, 3))print("pred_counts:", counts.tolist())print("avg_confidence:", round(confidence, 3))
Expected output:
training_signalsloss: 0.687grad_norm: 0.445pred_counts: [0, 12]avg_confidence: 0.69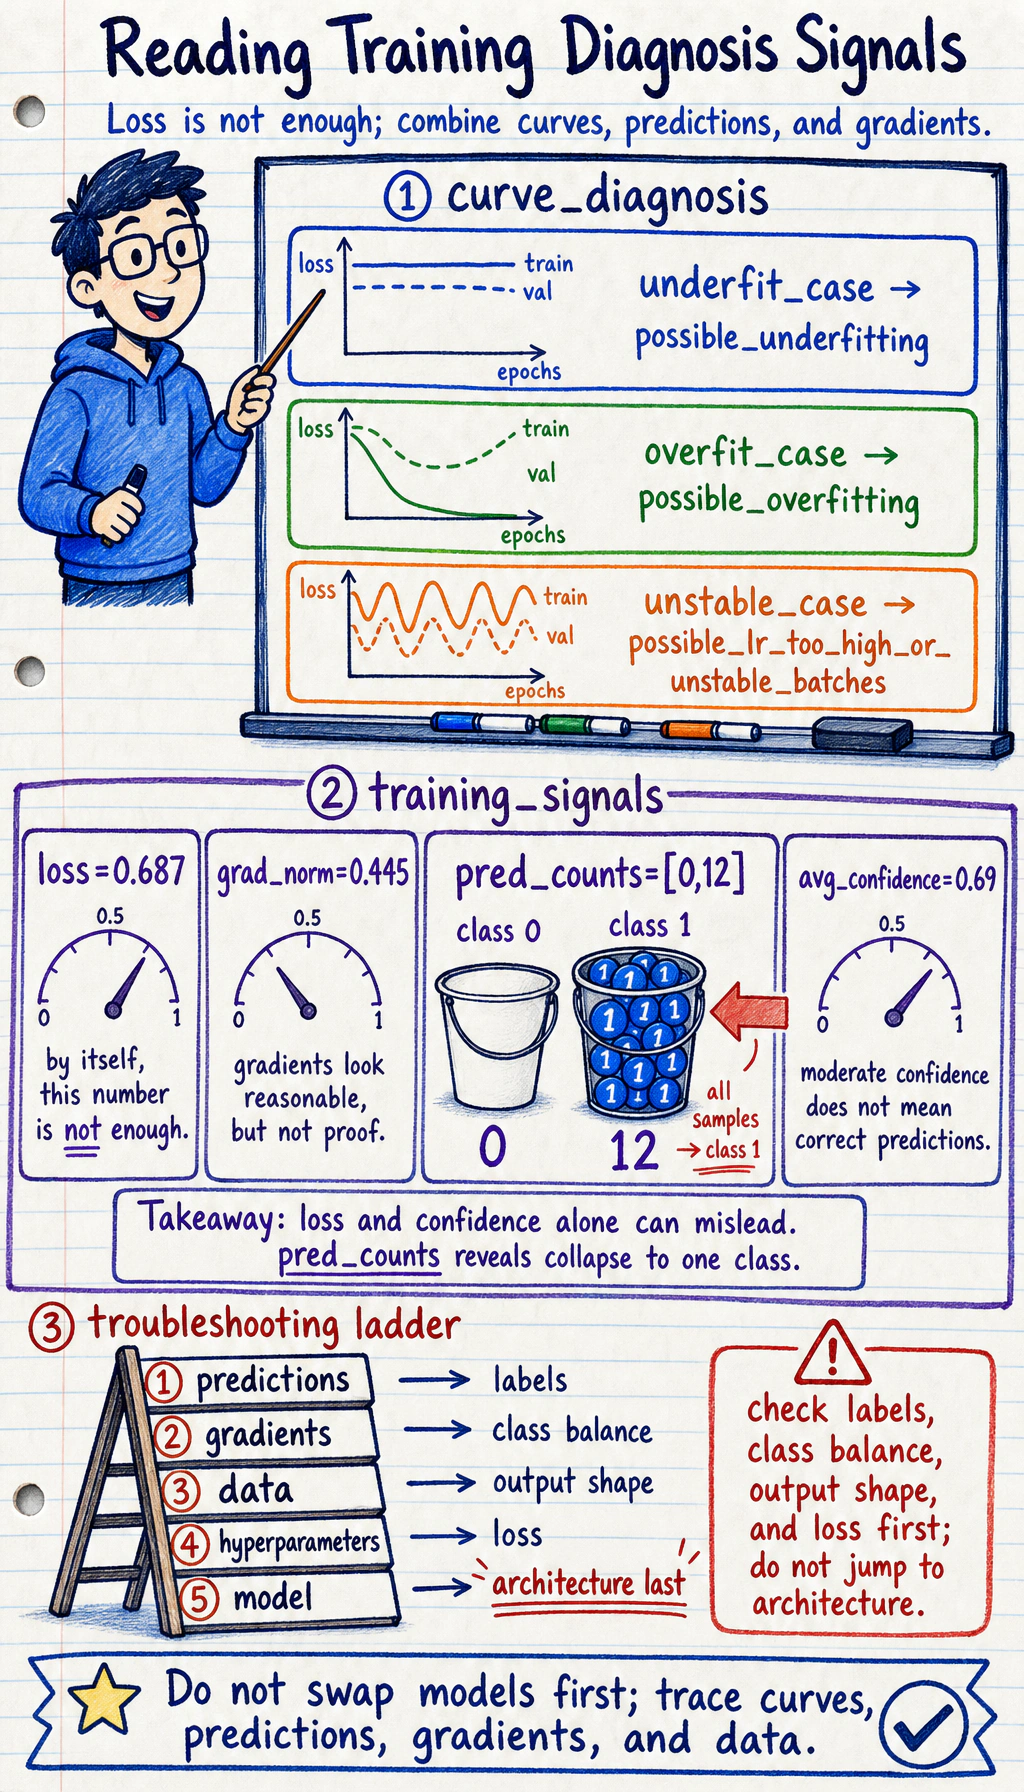
The important signal is pred_counts: [0, 12]. This initial model predicts class 1 for every sample. During real training, if this pattern persists, check class imbalance, labels, output layer shape, and loss setup.
A Troubleshooting Order
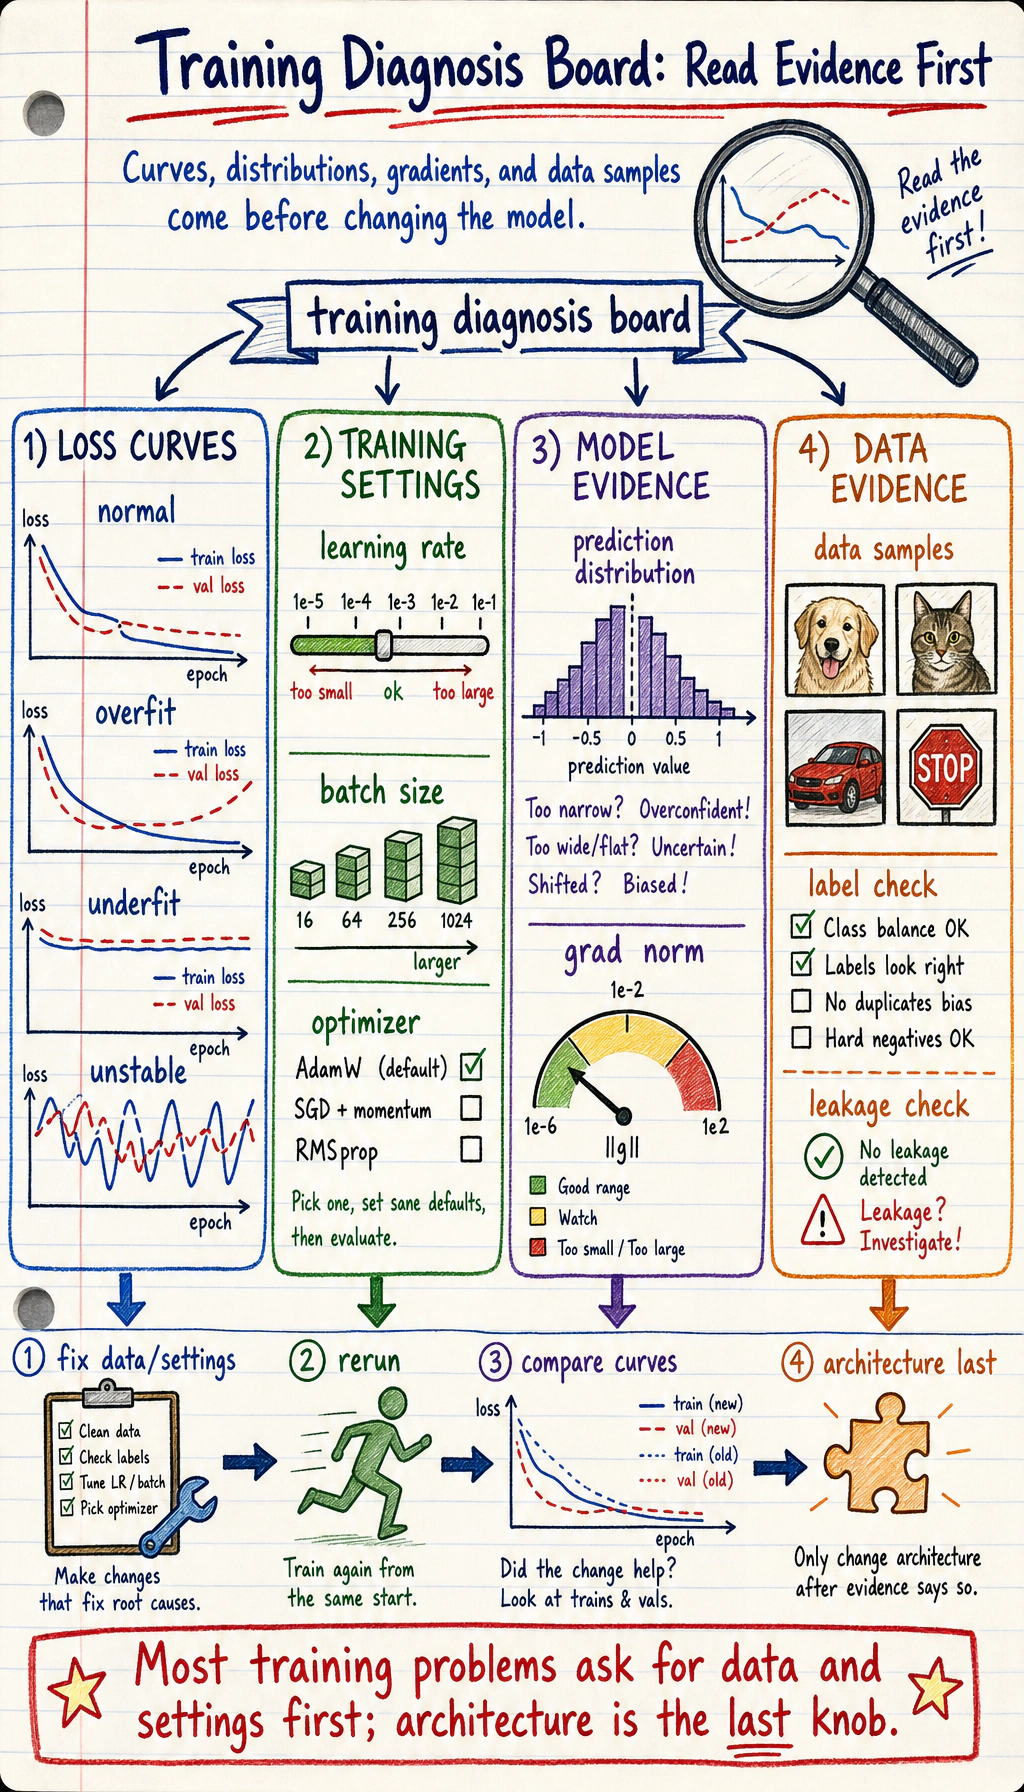
Section titled “A Troubleshooting Order”Use this order before changing the architecture:
- Curves: train/val loss and metrics.
- Predictions: class counts, confidence, best and worst examples.
- Gradients: norm, NaN/Inf, exploding or near-zero updates.
- Data: labels, leakage, split, preprocessing, augmentation.
- Hyperparameters: learning rate, batch size, regularization.
- Model: capacity, architecture, initialization.
This order is deliberately boring. That is why it works.
What to Save During Training
Section titled “What to Save During Training”| Artifact | Why save it |
|---|---|
| train/val curves | diagnose trend and overfitting |
| config and seed | reproduce the run |
| best checkpoint | compare without retraining |
| prediction samples | inspect failures directly |
| gradient statistics | catch instability early |
| data split version | detect leakage or drift |
Evidence to Keep
Section titled “Evidence to Keep”Every diagnosis should leave a symptom-to-action note:
- Curve Pattern
- underfit, overfit, unstable, collapse, or unclear
- Prediction Signal
- class counts and confidence
- Gradient Signal
- norm plus NaN/Inf check
- Data Check
- labels, split, leakage, preprocessing
- Chosen Action
- one targeted next experiment
- Success Rule
- what metric or artifact will prove the fix worked
Diagnosis to Action
Section titled “Diagnosis to Action”| Diagnosis | First action |
|---|---|
| possible underfitting | raise LR within reason, train longer, increase capacity, inspect labels |
| possible overfitting | early stopping, stronger regularization, more data, augmentation |
| unstable training | lower LR, increase batch, add gradient clipping |
| prediction collapse | check class balance, target encoding, output shape, loss function |
| data pipeline issue | print sample batches, verify preprocessing and split |
Common Mistakes
Section titled “Common Mistakes”| Mistake | Fix |
|---|---|
| only reading final accuracy | save full curves and best epoch |
| changing model before checking data | inspect sample batches and labels first |
| ignoring prediction distribution | print class counts or output summaries |
| assuming low train loss means success | compare validation and failure cases |
| making multiple fixes at once | choose one action and verify the result |
Exercises
Section titled “Exercises”- Add a
good_casehistory where train and val both improve. - Modify Lab 2 so the model has 3 classes. What changes in
torch.bincount? - Add a check that reports
has_nan_grad. - Write one next action for each diagnosis in Lab 1.
- Save a CSV-style log with
epoch,train_loss,val_loss,val_acc.
Reference implementation and walkthrough
- A
good_caseshould show train and validation loss both decreasing, with validation accuracy improving or staying stable. It is the reference pattern for healthy training. - With 3 classes,
torch.bincount(preds, minlength=3)should report three bins. The classifier output and labels must also use three classes. has_nan_gradshould scan parameter gradients afterbackward(). If any gradient is non-finite, stop and inspect learning rate, loss, input scale, and labels.- Underfitting needs capacity, time, or learning-rate checks; overfitting needs regularization or more data; instability needs smaller LR or clipping; collapse needs label/output/loss checks.
- A CSV log should let you reconstruct the curve later. At minimum, each row needs epoch, train loss, validation loss, and validation accuracy.
Key Takeaways
Section titled “Key Takeaways”- Symptoms are not root causes.
- Curves are the first diagnostic surface.
- Predictions and gradients reveal failures that loss can hide.
- Data checks come before architecture changes.
- A good diagnosis ends with one targeted next experiment.