
5.2.4 Decision Trees
What You Will Build
Section titled “What You Will Build”In this lesson you will run one script that shows:
- how tree depth changes train/test accuracy;
- how to print readable tree rules;
- how feature importance is computed from splits;
- how post-pruning with
ccp_alphachanges the number of leaves; - how a regression tree makes step-like numeric predictions.
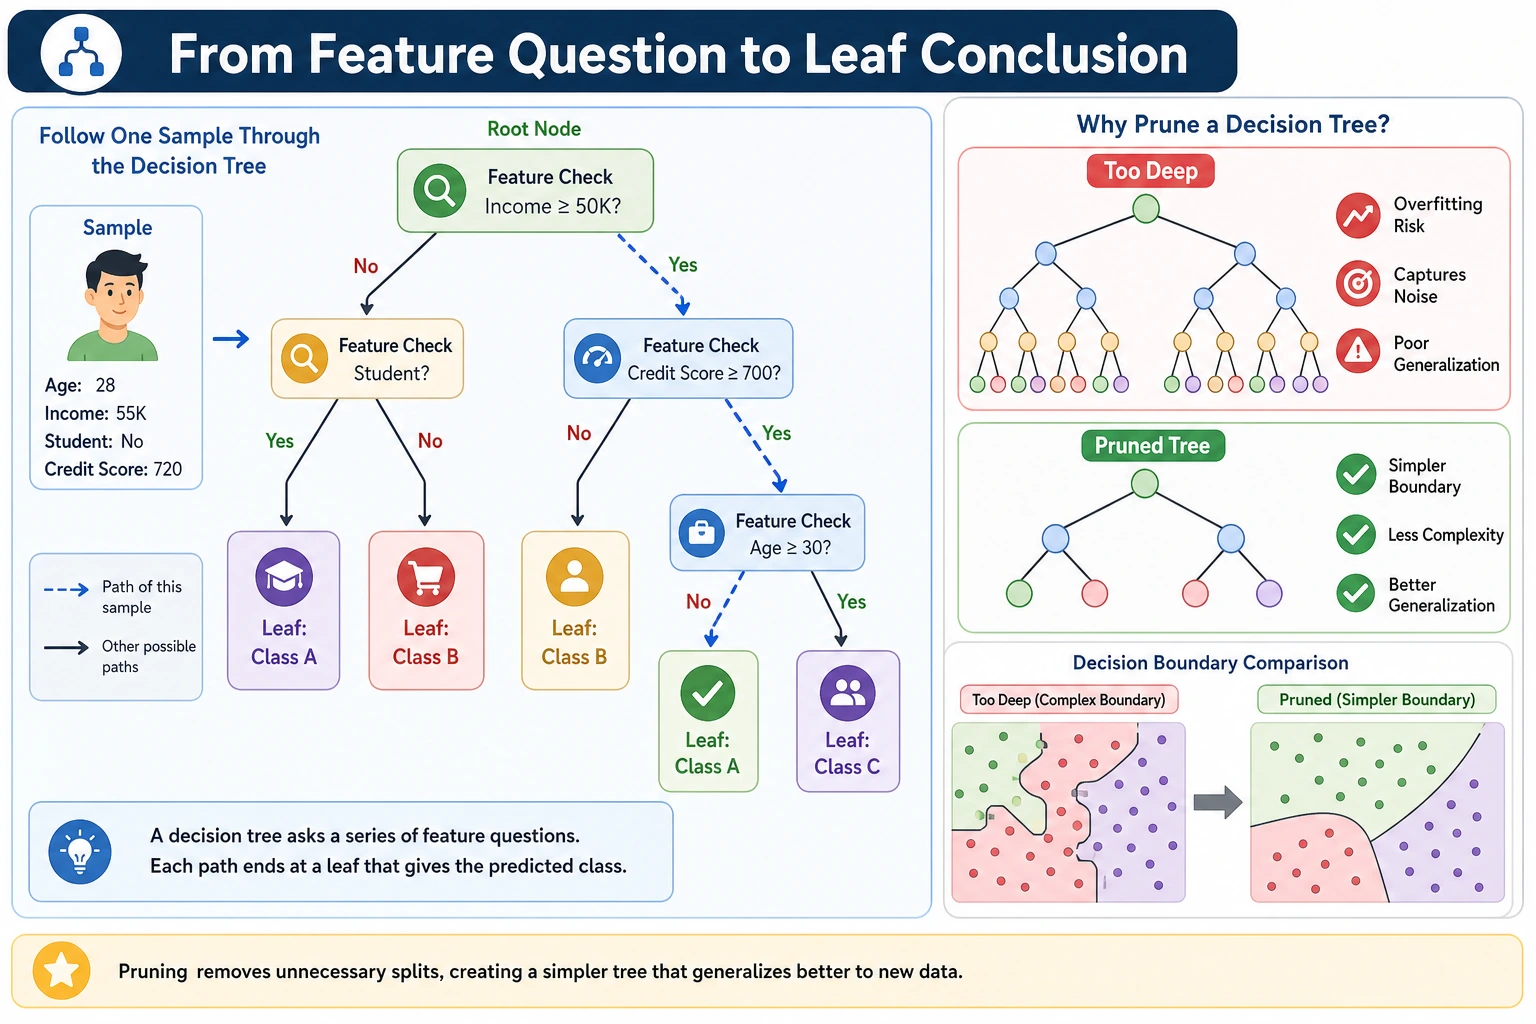
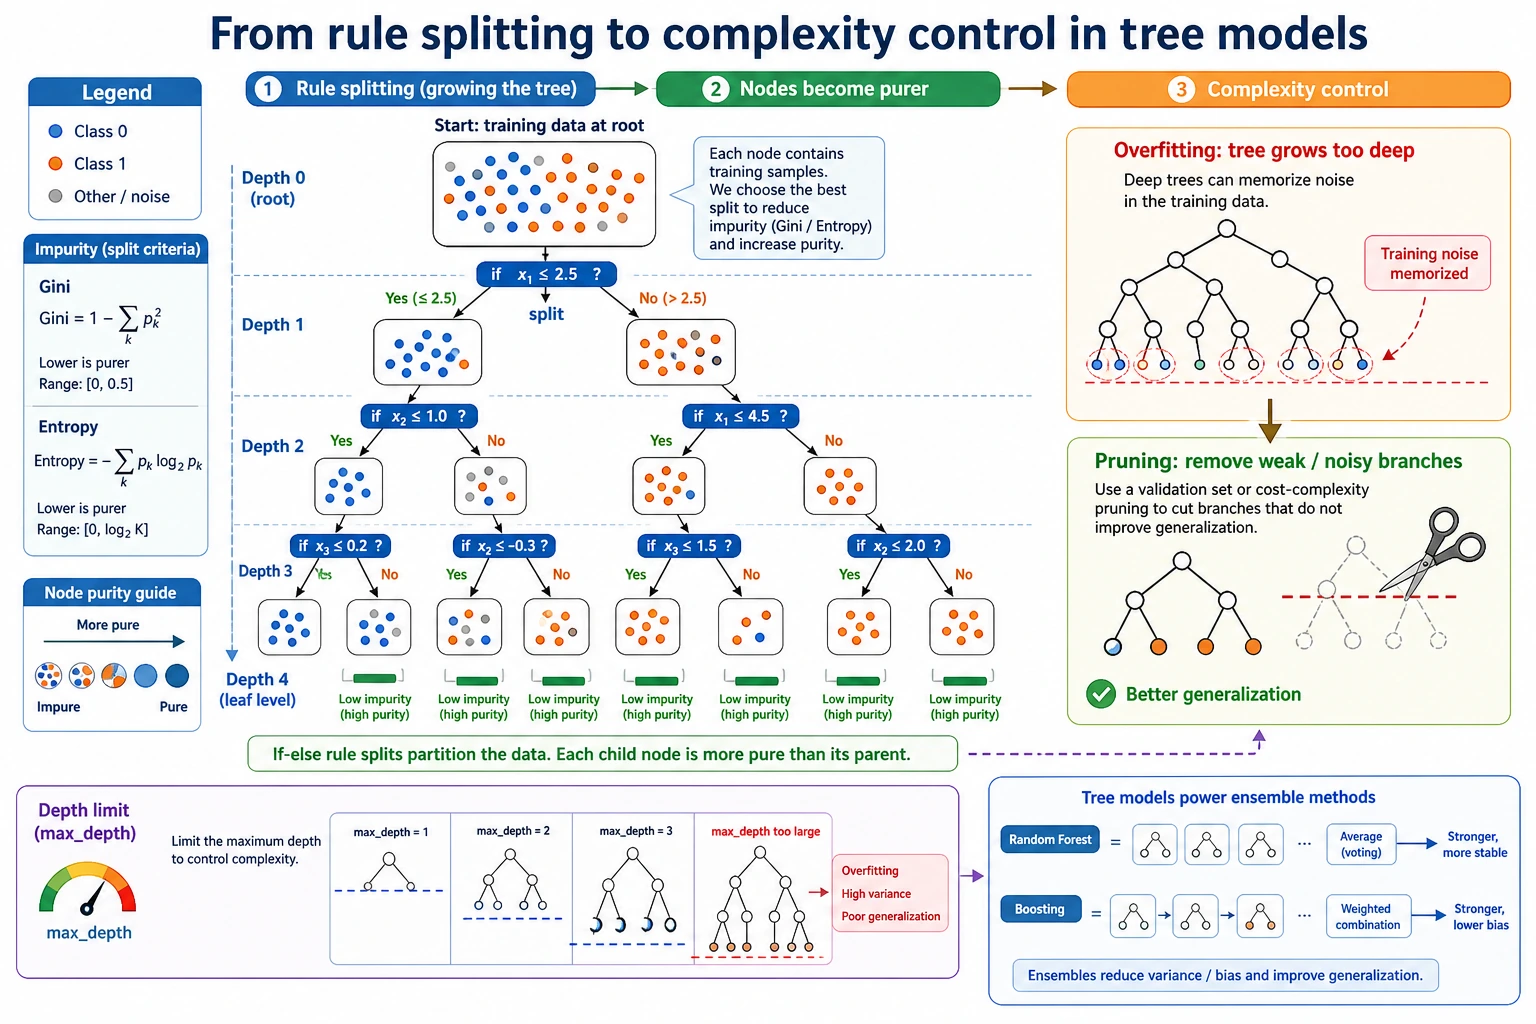
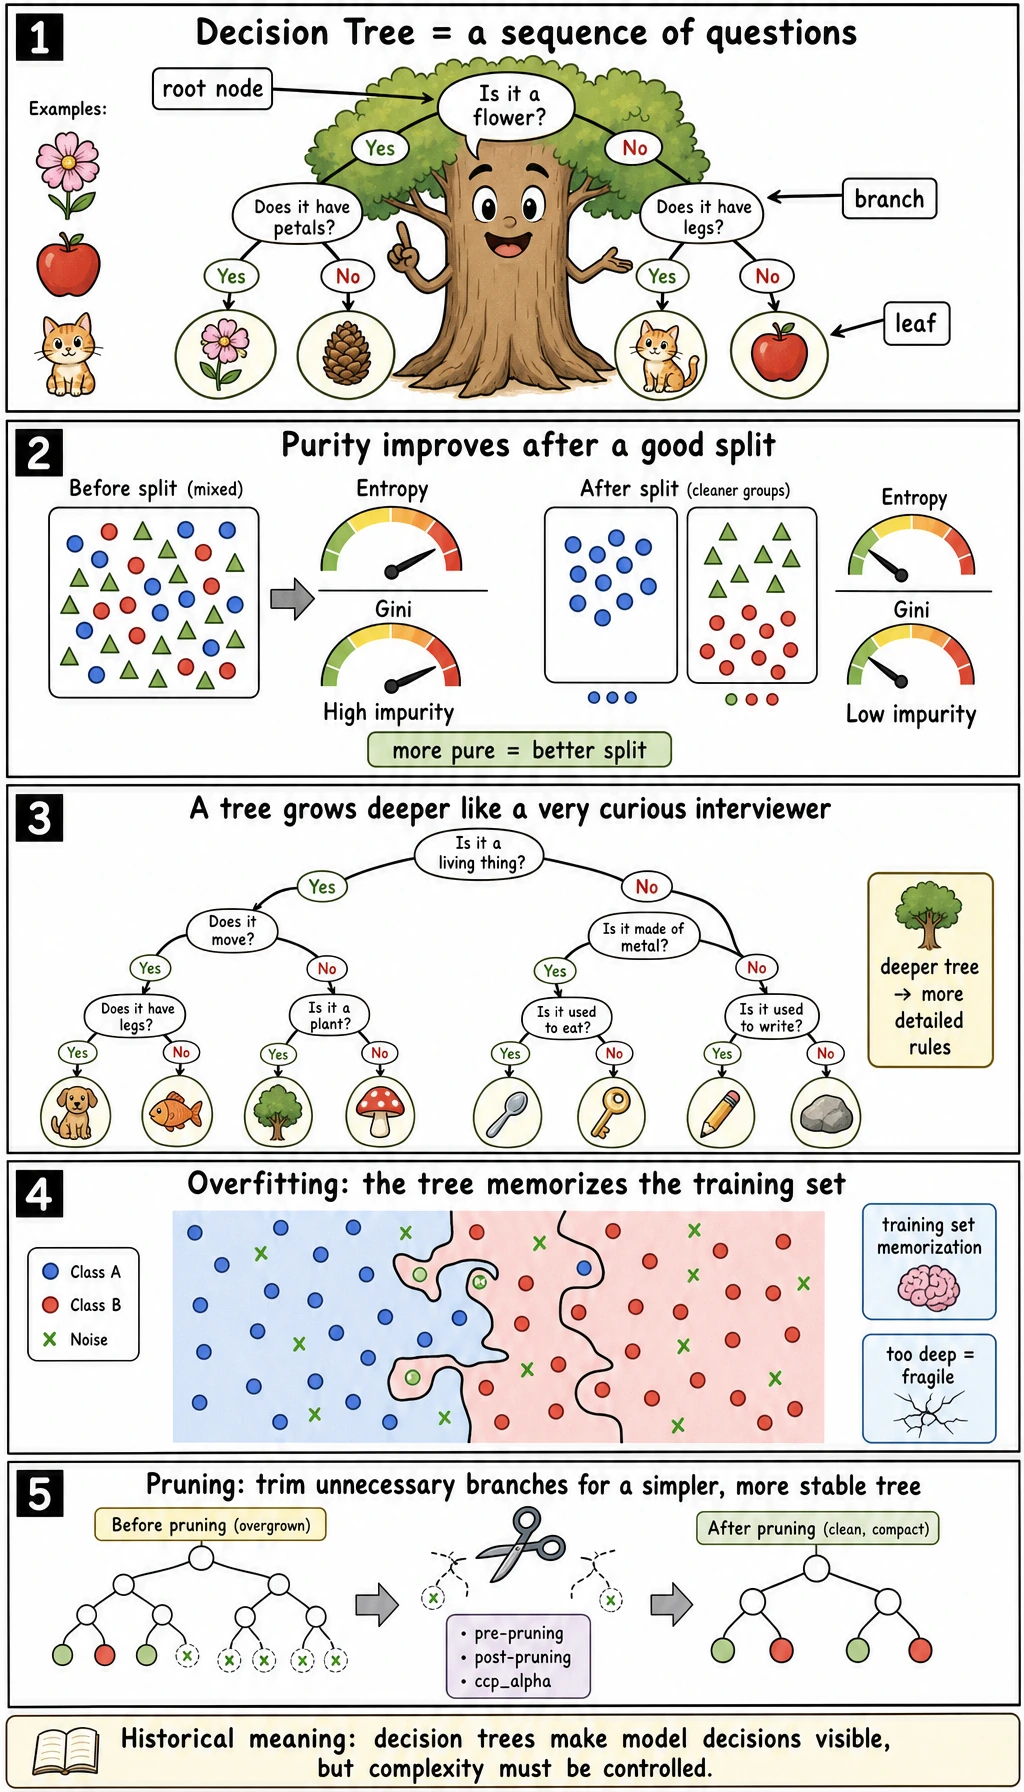
Read the maps first. A tree is not just “if-else”; it is “if-else plus a scoring rule plus complexity control.”
python -m pip install -U scikit-learnThis lesson uses sklearn’s CART-style DecisionTreeClassifier and DecisionTreeRegressor. CART means Classification and Regression Trees: the same tree idea can handle both labels and numbers.
Run the Complete Lab
Section titled “Run the Complete Lab”Create decision_tree_lab.py:
from sklearn.datasets import load_diabetes, load_irisfrom sklearn.metrics import accuracy_score, mean_absolute_errorfrom sklearn.model_selection import train_test_splitfrom sklearn.tree import DecisionTreeClassifier, DecisionTreeRegressor, export_text

iris = load_iris()X = iris.data[:, 2:4]  # petal length and petal width, easier to ready = iris.targetX_train, X_test, y_train, y_test = train_test_split(    X, y, test_size=0.25, random_state=42, stratify=y)
print("classification_depth_lab")for depth in [1, 2, 3, None]:    tree = DecisionTreeClassifier(max_depth=depth, min_samples_leaf=3, random_state=42)    tree.fit(X_train, y_train)    train_acc = accuracy_score(y_train, tree.predict(X_train))    test_acc = accuracy_score(y_test, tree.predict(X_test))    print(        f"max_depth={str(depth):<4} "        f"train={train_acc:.3f} test={test_acc:.3f} "        f"leaves={tree.get_n_leaves()} depth={tree.get_depth()}"    )
best_tree = DecisionTreeClassifier(max_depth=3, min_samples_leaf=3, random_state=42)best_tree.fit(X_train, y_train)print("tree_rules")print(export_text(best_tree, feature_names=["petal length", "petal width"], decimals=2, max_depth=3))
print("feature_importance")for name, value in zip(["petal length", "petal width"], best_tree.feature_importances_):    print(f"- {name}: {value:.3f}")
print("pruning_lab")path = DecisionTreeClassifier(random_state=42).cost_complexity_pruning_path(X_train, y_train)for alpha in path.ccp_alphas[[0, 1, -2]]:    pruned = DecisionTreeClassifier(random_state=42, ccp_alpha=float(alpha))    pruned.fit(X_train, y_train)    print(        f"ccp_alpha={alpha:.4f} "        f"test={accuracy_score(y_test, pruned.predict(X_test)):.3f} "        f"leaves={pruned.get_n_leaves()}"    )
print("regression_tree_lab")diabetes = load_diabetes()X_train, X_test, y_train, y_test = train_test_split(    diabetes.data, diabetes.target, test_size=0.25, random_state=42)for depth in [2, 4, None]:    reg = DecisionTreeRegressor(max_depth=depth, min_samples_leaf=10, random_state=42)    reg.fit(X_train, y_train)    pred = reg.predict(X_test)    print(f"max_depth={str(depth):<4} mae={mean_absolute_error(y_test, pred):.1f} leaves={reg.get_n_leaves()}")
Run it:
python decision_tree_lab.pyExpected output:
classification_depth_labmax_depth=1    train=0.670 test=0.658 leaves=2 depth=1max_depth=2    train=0.964 test=0.947 leaves=3 depth=2max_depth=3    train=0.982 test=0.974 leaves=5 depth=3max_depth=None train=0.982 test=0.974 leaves=5 depth=3tree_rules|--- petal length <= 2.45|   |--- class: 0|--- petal length >  2.45|   |--- petal width <= 1.70|   |   |--- petal length <= 4.95|   |   |   |--- class: 1|   |   |--- petal length >  4.95|   |   |   |--- class: 2|   |--- petal width >  1.70|   |   |--- petal length <= 4.95|   |   |   |--- class: 2|   |   |--- petal length >  4.95|   |   |   |--- class: 2
feature_importance- petal length: 0.588- petal width: 0.412pruning_labccp_alpha=0.0000 test=0.921 leaves=7ccp_alpha=0.0067 test=0.921 leaves=5ccp_alpha=0.2636 test=0.658 leaves=2regression_tree_labmax_depth=2    mae=47.3 leaves=4max_depth=4    mae=44.4 leaves=14max_depth=None mae=48.7 leaves=25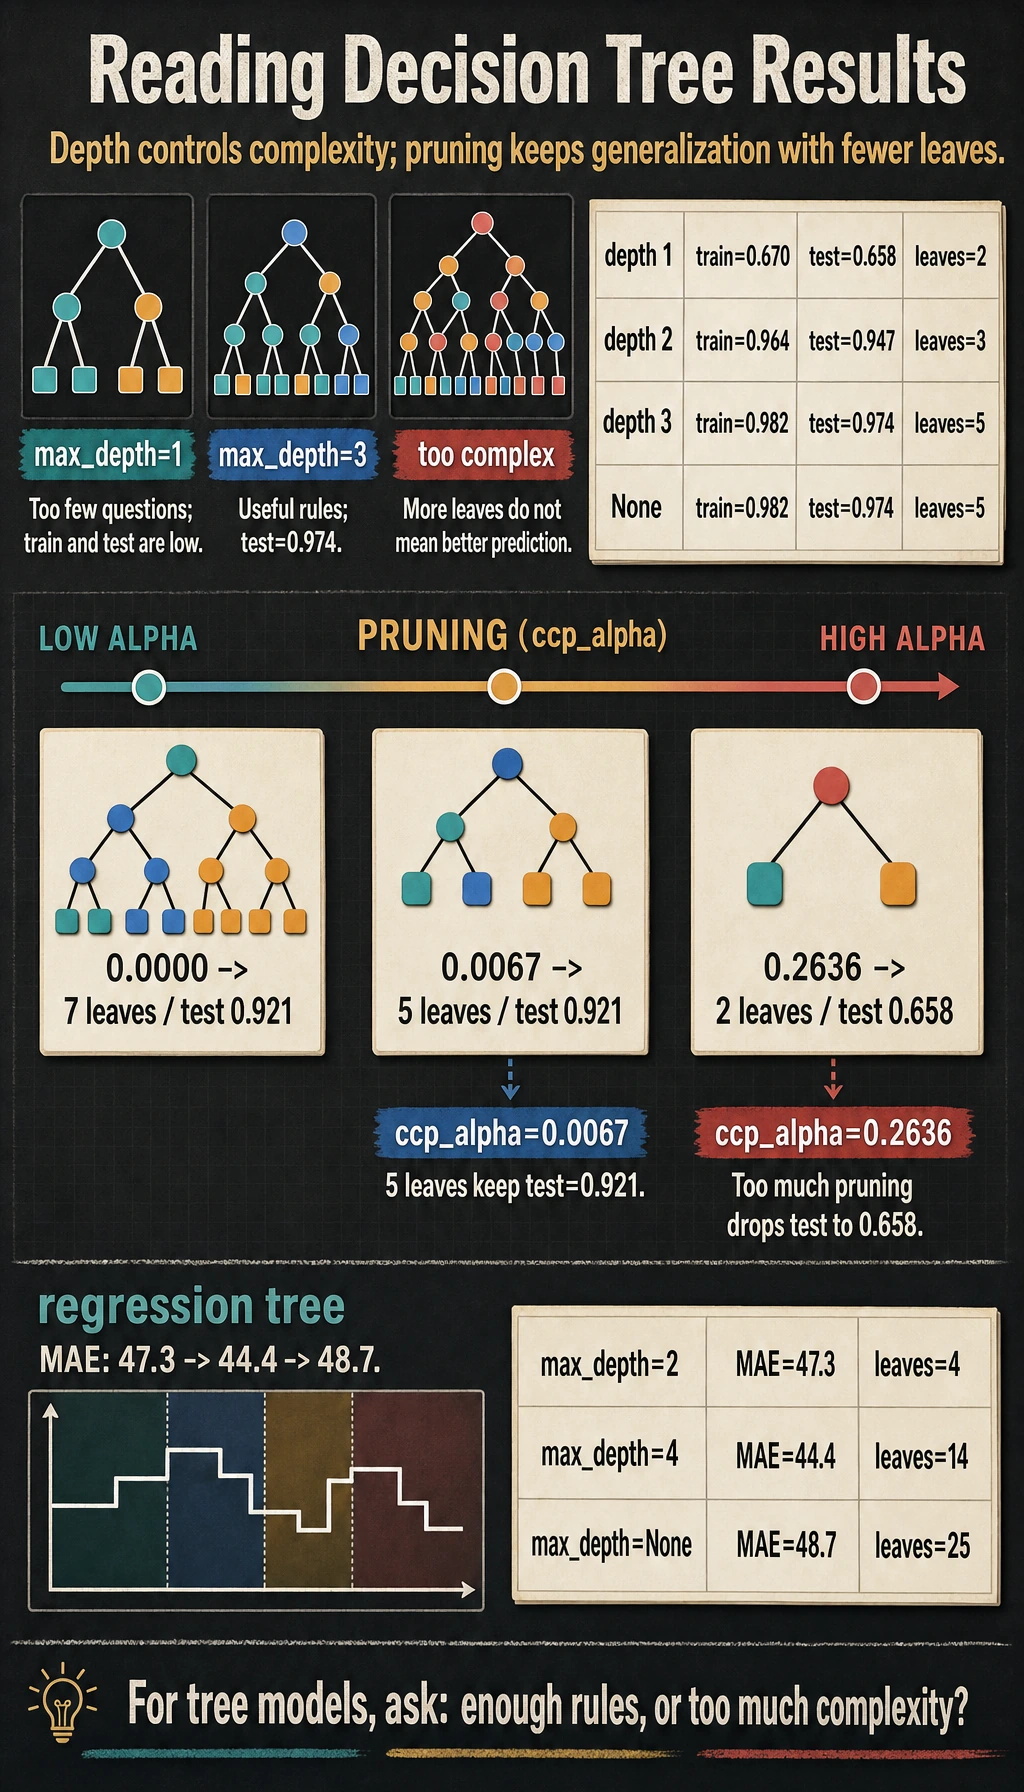
Read the Output
Section titled “Read the Output”The first block is the most important part:
max_depth=1 train=0.670 test=0.658 leaves=2 depth=1max_depth=3 train=0.982 test=0.974 leaves=5 depth=3max_depth=1 asks only one question, so the model is too simple. max_depth=3 asks a few follow-up questions and performs much better. On this tiny dataset, max_depth=None does not grow deeper because min_samples_leaf=3 and the data are already simple enough.
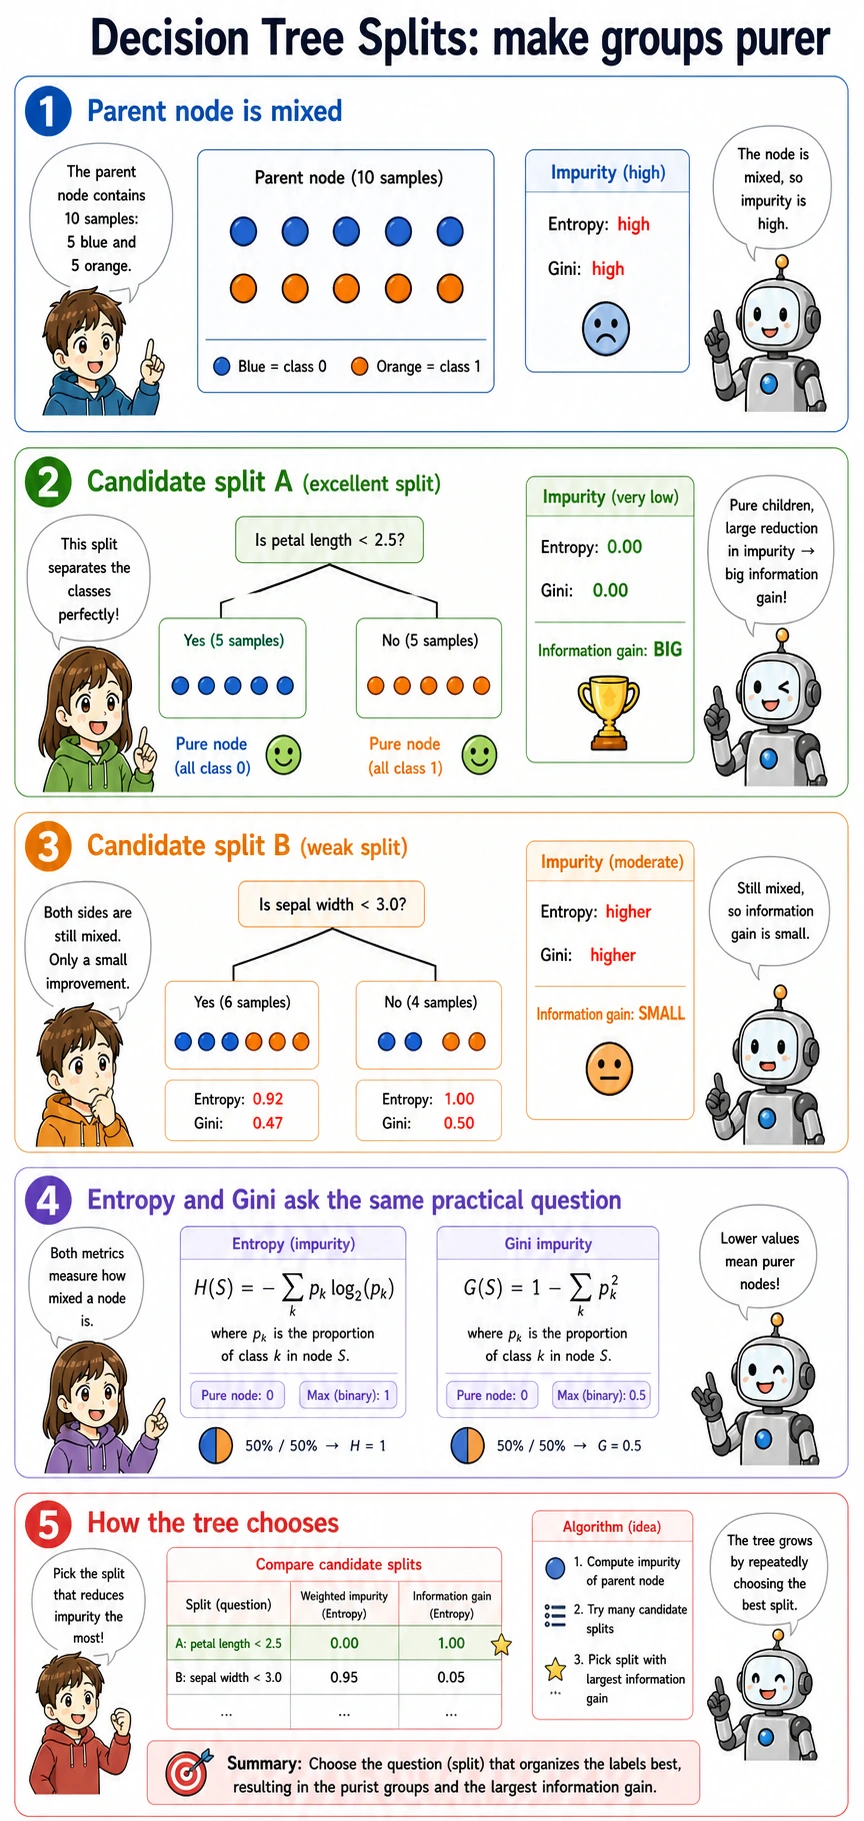
At each node, the tree searches for a question like:
petal length <= 2.45?The chosen split should make the child nodes cleaner than the parent node. Cleaner means the labels inside a node are less mixed.
Gini, Entropy, and Information Gain
Section titled “Gini, Entropy, and Information Gain”You do not need to memorize every formula on first pass. Remember the job:
| Term | Practical meaning |
|---|---|
Gini | How mixed the labels are in a node; sklearn’s default for classification trees |
entropy | Another mixedness score, connected to information theory |
information gain | How much mixedness drops after a split |
criterion | The setting that chooses the scoring rule, such as criterion="gini" or criterion="entropy" |
Use gini first unless you have a reason to compare. In many tabular projects, tuning depth, leaf size, and pruning matters more than switching from Gini to entropy.
Complexity Control
Section titled “Complexity Control”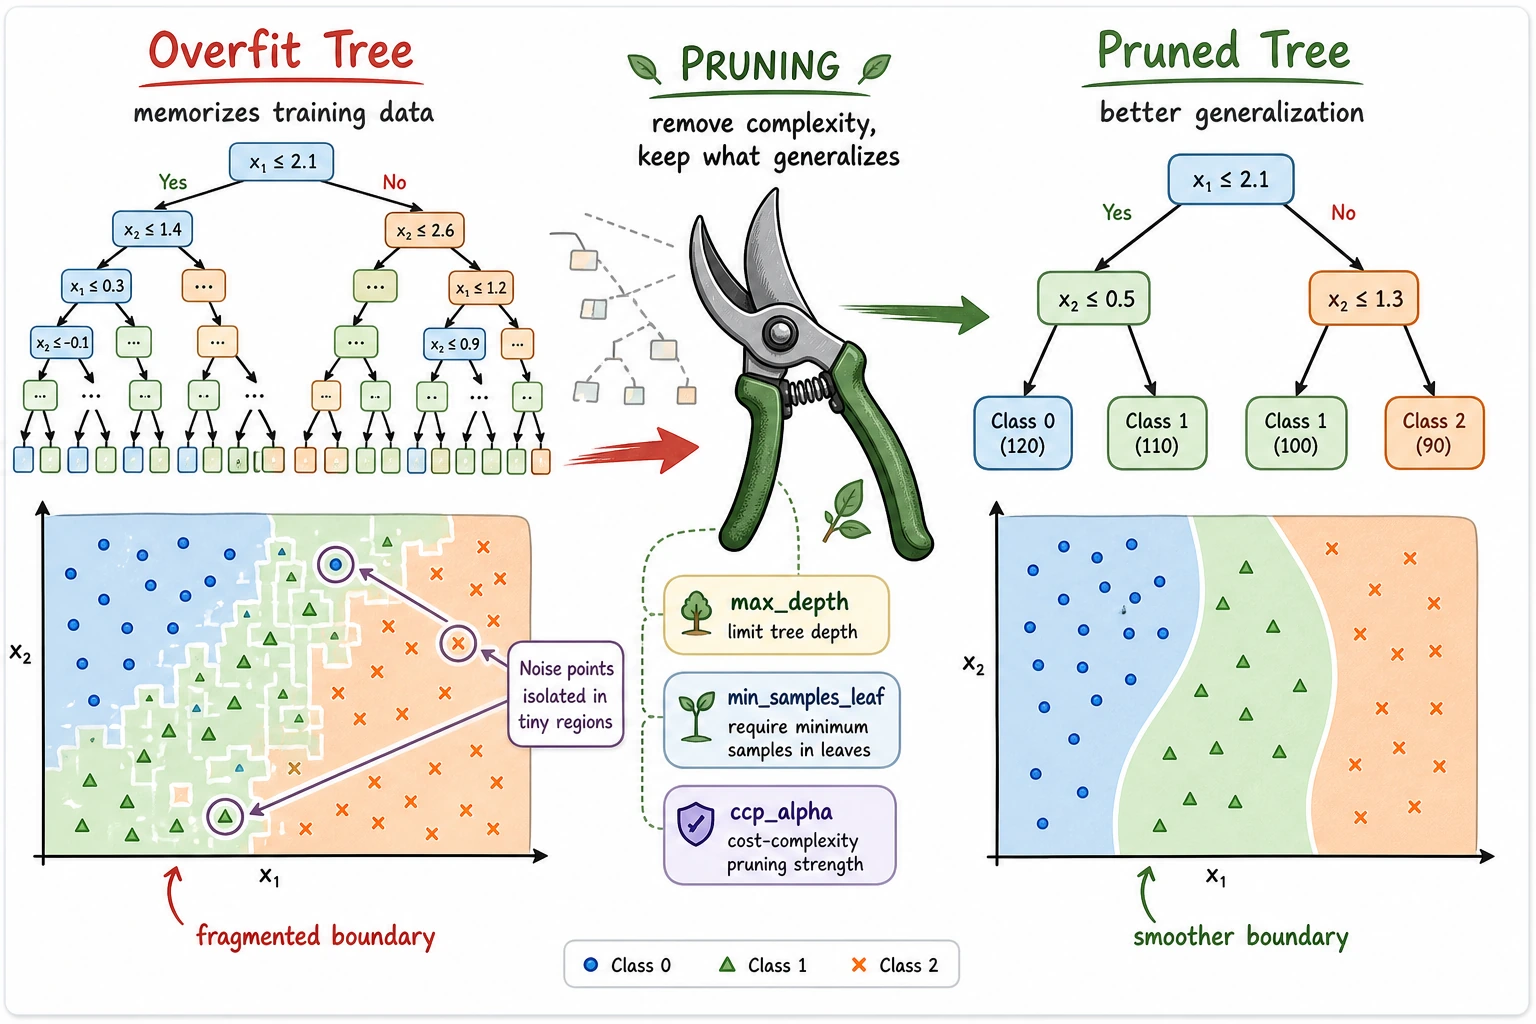
The practical tuning order is:
- Set
max_depthto stop the tree from growing too deep. - Set
min_samples_leafso each leaf has enough examples. - Use
ccp_alphafor post-pruning after a full tree is grown.
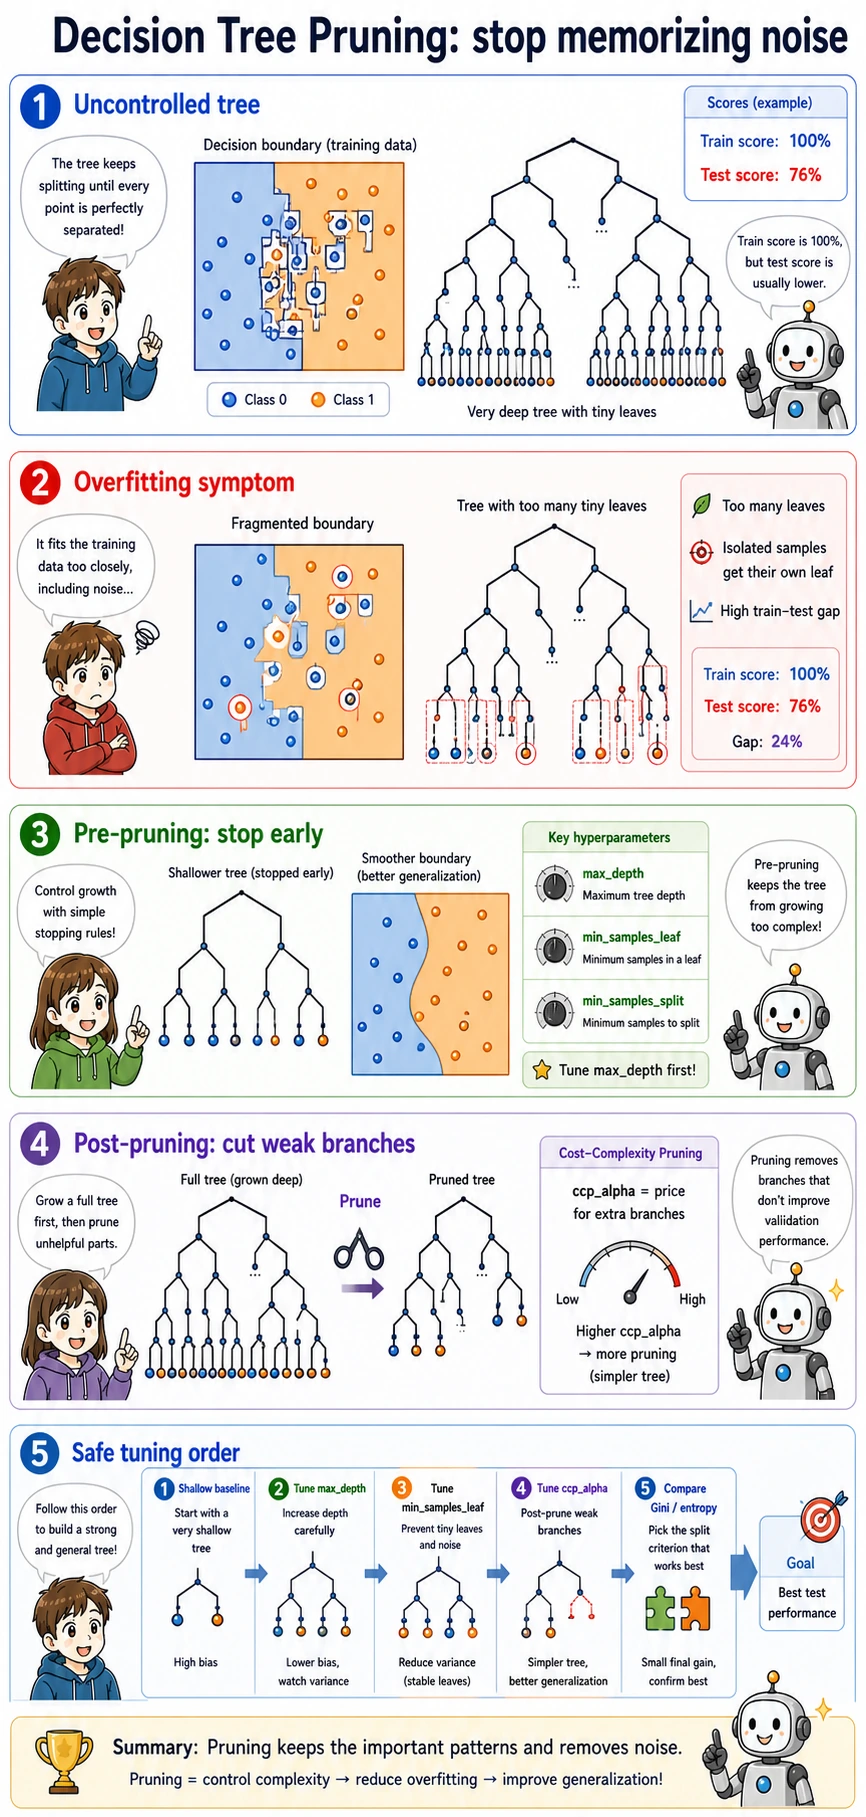
The pruning output shows the trade-off:
ccp_alpha=0.0000 test=0.921 leaves=7ccp_alpha=0.0067 test=0.921 leaves=5ccp_alpha=0.2636 test=0.658 leaves=2A little pruning kept the same test score with fewer leaves. Too much pruning collapsed the tree into only two leaves and lost useful rules.
Interpretability
Section titled “Interpretability”export_text() prints the path a sample will follow. This is useful when you need to explain a prediction to a teammate:
|--- petal length <= 2.45| |--- class: 0Feature importance is also useful, but read it carefully:
- it tells you which features reduced impurity most in this fitted tree;
- it can favor features with many possible split points;
- correlated features can share or hide importance;
- it is not the same as causal importance.
For stronger interpretation, compare tree importance with permutation importance later.
Regression Trees
Section titled “Regression Trees”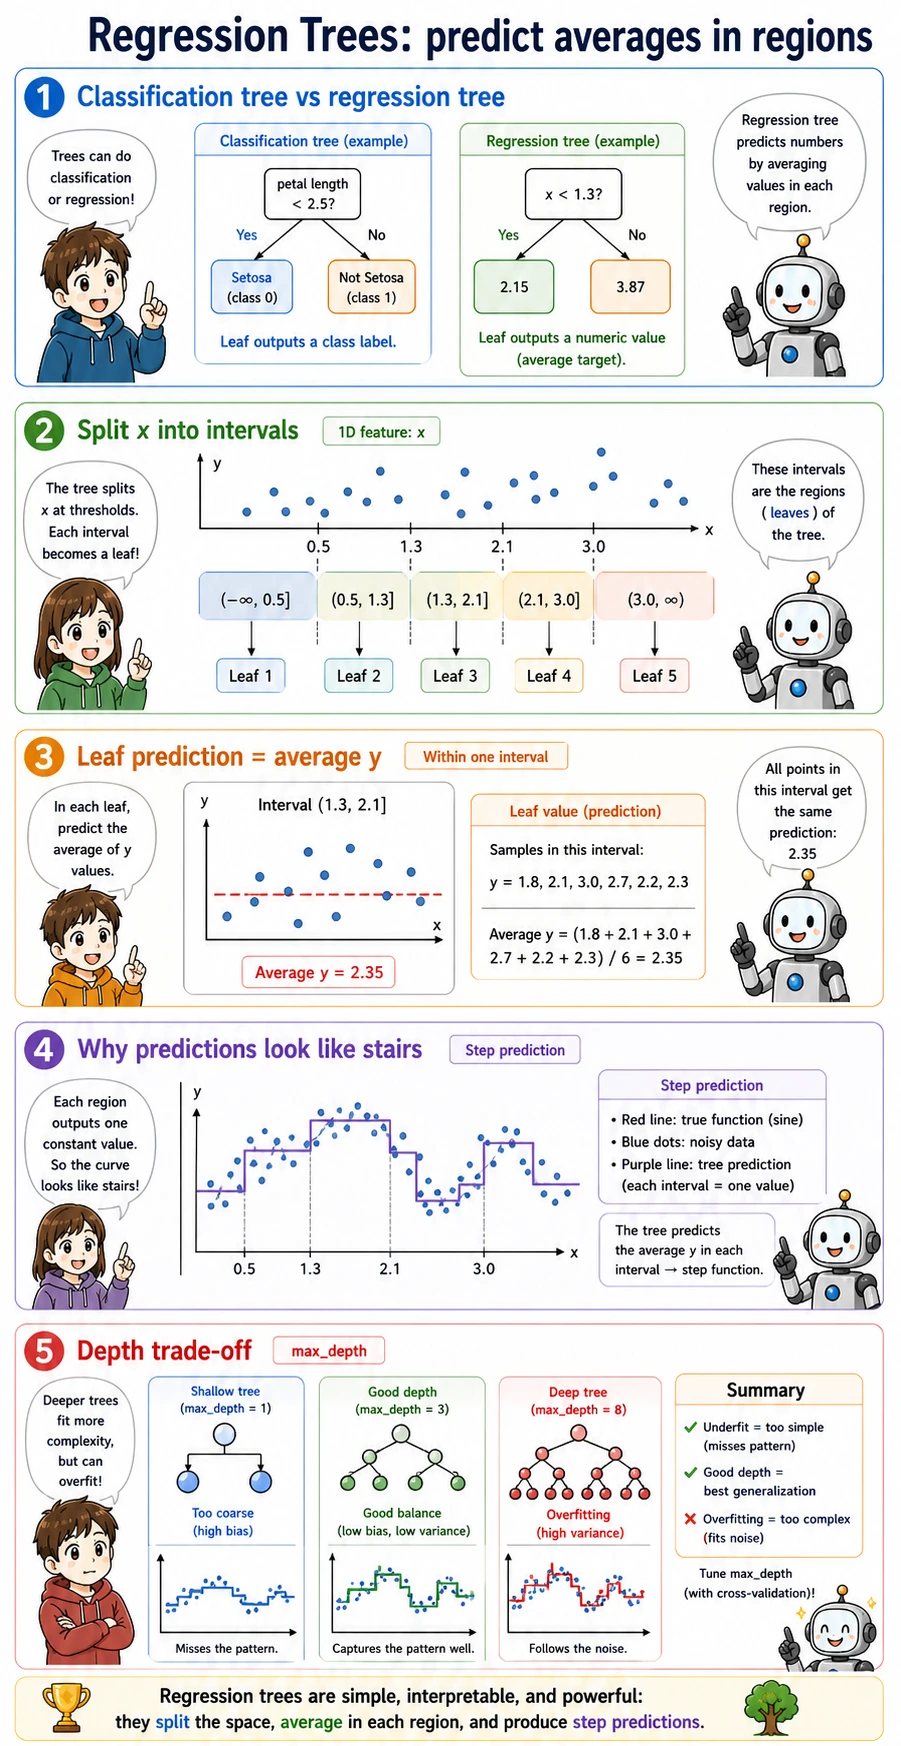
A regression tree predicts numbers, but the idea is the same: split the feature space into regions, then output the average target value in each leaf.
That is why regression tree predictions often look like steps rather than a smooth line. In the lab:
max_depth=4 mae=44.4 leaves=14max_depth=None mae=48.7 leaves=25The deeper tree has more leaves, but its test MAE is worse. More rules do not automatically mean better generalization.
When to Use a Single Decision Tree
Section titled “When to Use a Single Decision Tree”Use a single tree when you need:
- a quick, explainable baseline;
- simple rule extraction for a business process;
- a visual way to explain non-linear splits;
- a stepping stone before Random Forest or boosting.
Avoid relying on a single tree when:
- small data changes create very different trees;
- test score drops far below train score;
- the problem needs the accuracy and stability of ensembles.
Practical Debugging Checklist
Section titled “Practical Debugging Checklist”| Symptom | Likely cause | Fix |
|---|---|---|
| Train score is high, test score is low | tree is too deep | lower max_depth, increase min_samples_leaf, try pruning |
| Tree has many tiny leaves | memorizing rare cases | increase min_samples_leaf |
| Feature importance feels misleading | correlated or high-cardinality features | verify with permutation importance |
| Rules are hard to read | tree is too large | train a smaller explanation tree, or summarize paths |
| Regression tree predictions look blocky | leaf averages create step outputs | compare with linear models, random forests, or gradient boosting |
Practice
Section titled “Practice”- Change
min_samples_leaffrom3to1, then to10. What happens to leaves and test accuracy? - Change
criterionto"entropy". Does the tree choose the same first split? - Print
export_text()for a tree withmax_depth=2. Is it easier to explain? - Replace the Iris features with all four features. Does feature importance change?
- In the regression section, compare
DecisionTreeRegressorwith the linear regression lesson’s baseline.
Reference implementation and walkthrough
min_samples_leaf=1usually creates more leaves and can overfit.10creates a simpler tree; test accuracy may improve if the old tree was too specific, or drop if it becomes too coarse.- Entropy and Gini often choose similar splits, but they are not guaranteed to match. Compare the first rule and the resulting test score.
- A depth-2 tree is much easier to explain because it has only a few rules, but it may miss detail that a deeper tree captures.
- Using all four Iris features can change importances and splits. Treat importance as a model diagnostic, not proof of causality.
- Regression trees produce step-like predictions based on leaf averages. Compare RMSE/MAE against the linear baseline and inspect residual examples before deciding which is better.
Evidence to Keep
Section titled “Evidence to Keep”Keep this page’s proof of learning as a small evidence card:
- Task
- regression or classification problem with target definition
- Model
- linear/logistic/tree/ensemble/SVM configuration and train/test split
- Metric
- regression error, accuracy/F1, threshold curve, or confusion matrix
- Failure Check
- overfitting, underfitting, feature scaling, threshold choice, or class imbalance
- Expected Output
- model result plus error samples or residual review
Pass Check
Section titled “Pass Check”You are done when you can explain:
- a tree learns by choosing splits that make child nodes cleaner;
- deeper trees can memorize training data;
max_depth,min_samples_leaf, andccp_alphacontrol complexity;- feature importance is useful but not automatically causal;
- regression trees output leaf averages, so predictions are step-like.