
3.6.3 Follow-Along Workshop: Build a Reproducible Data Analysis Pipeline
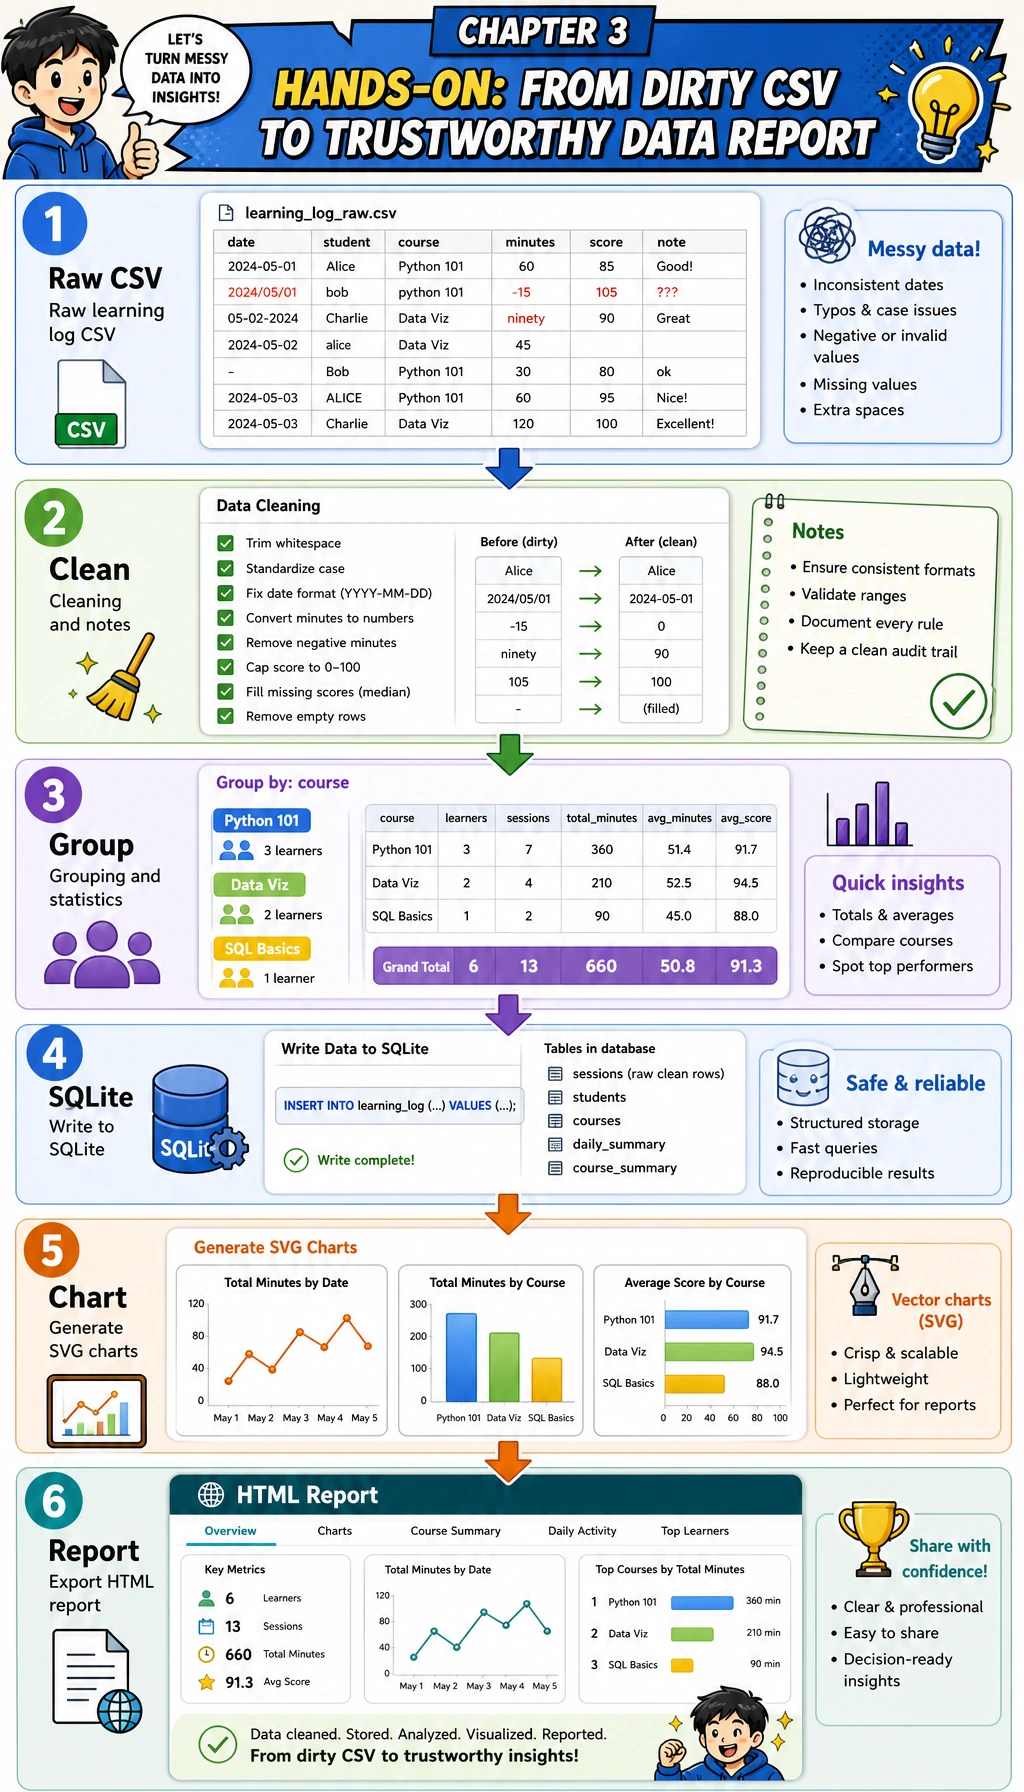
What you will build
Section titled “What you will build”You will create a small learning-log analysis pipeline. It does not need external packages, so it works with the Python standard library on a fresh machine. That makes the workflow easy to run first; later you can upgrade the same steps to Pandas, Matplotlib, or a Notebook.
By the end, your folder will contain:
| File | Meaning |
|---|---|
raw_learning_log.csv | The intentionally dirty input data |
clean_learning_log.csv | The cleaned table used for analysis |
cleaning_log.json | A record of every dropped row and the reason |
learning_log.sqlite3 | A SQLite database created from the cleaned rows |
topic_minutes.svg | A chart generated by the script |
report.html | A simple analysis report you can open in a browser |
Step 0: Create a clean practice folder
Section titled “Step 0: Create a clean practice folder”Run these commands in a terminal. If you are on Windows, use PowerShell and replace python3 with python if needed.
mkdir ch03-learning-log-workshopcd ch03-learning-log-workshoppython3 --versionExpected output will look similar to this. The exact version number can be different.
Python 3.12.3Keep this terminal open. All following commands assume you are inside ch03-learning-log-workshop.
Step 1: Understand the pipeline before writing code
Section titled “Step 1: Understand the pipeline before writing code”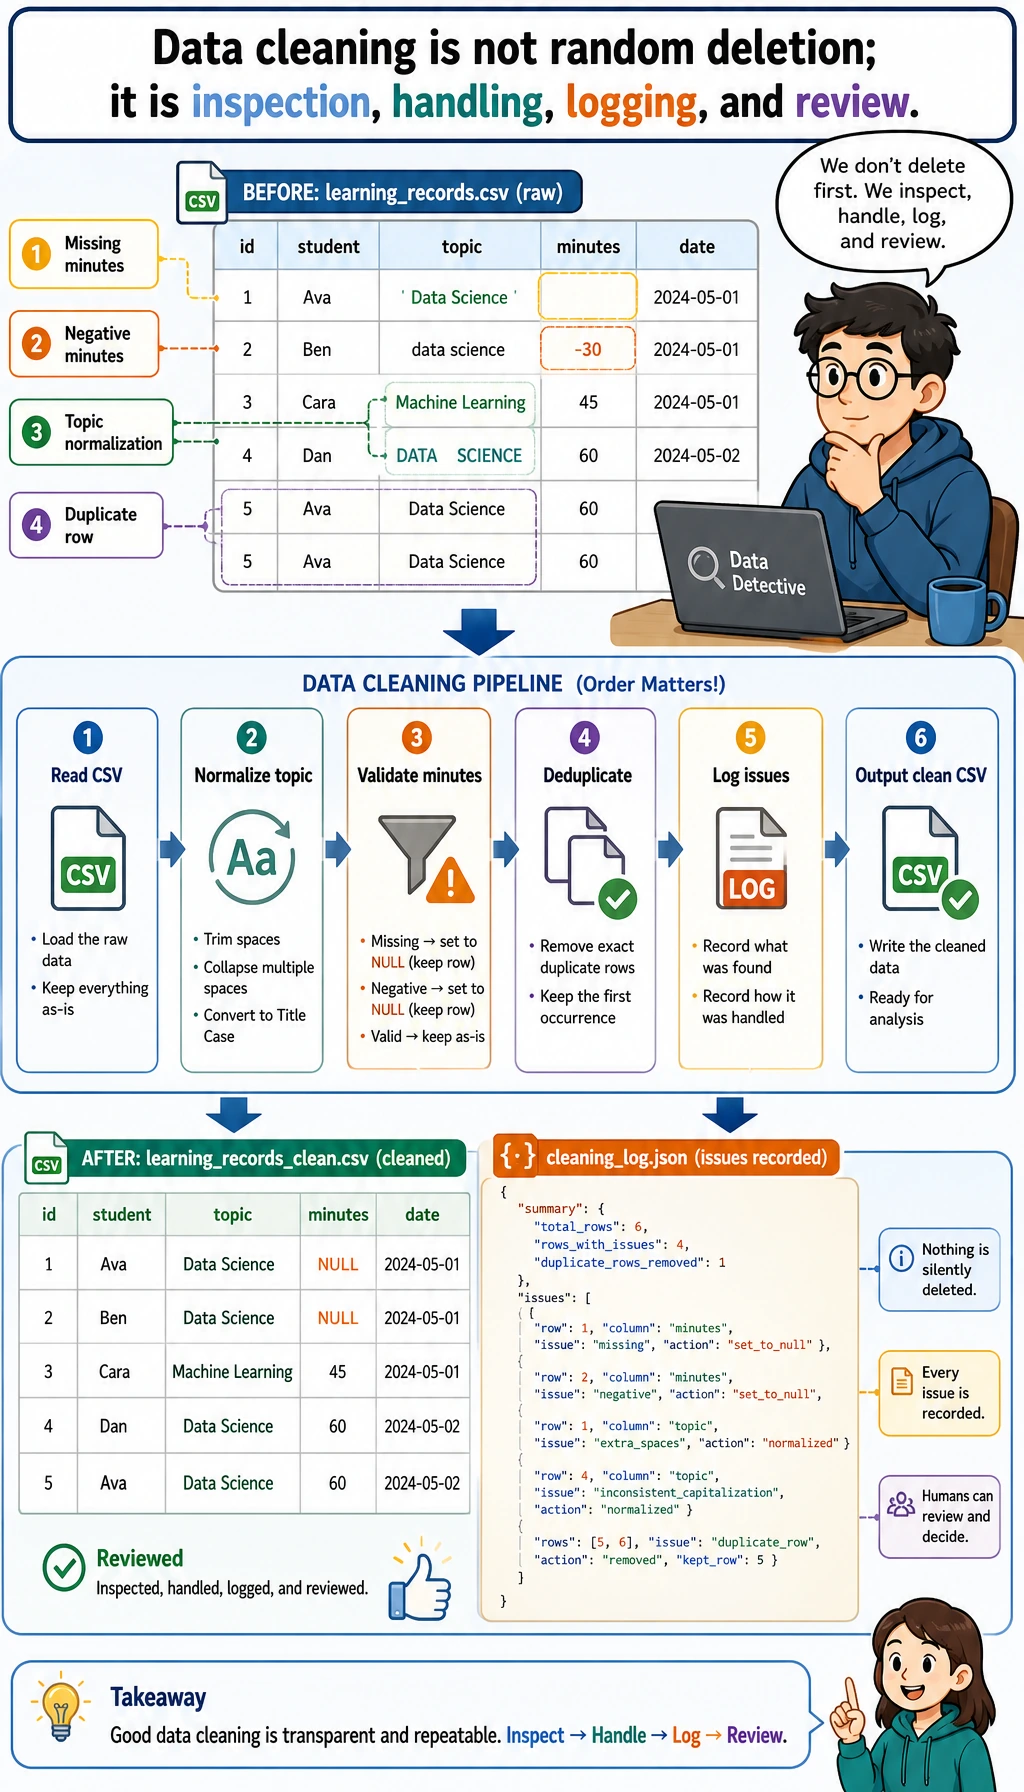
The key idea is simple: never jump from raw data to conclusions. A trustworthy analysis keeps evidence for each transformation.
| Stage | Question | Output |
|---|---|---|
| Generate input | What does the raw data look like? | raw_learning_log.csv |
| Clean | Which rows are invalid or duplicated? | clean_learning_log.csv, cleaning_log.json |
| Summarize | Which topic took the most time? | grouped topic statistics |
| Query | Can the same clean data be queried like a database? | learning_log.sqlite3 |
| Visualize | Which result should be seen at a glance? | topic_minutes.svg |
| Report | What should another person believe and verify? | report.html |
Step 2: Create the runnable script
Section titled “Step 2: Create the runnable script”Create a file named learning_log_pipeline.py, then paste the full script below.
from __future__ import annotations
import csvimport htmlimport jsonimport sqlite3from collections import defaultdictfrom pathlib import Pathfrom statistics import mean
OUTPUT_DIR = Path("ch03_output")RAW_CSV = OUTPUT_DIR / "raw_learning_log.csv"CLEAN_CSV = OUTPUT_DIR / "clean_learning_log.csv"DATABASE = OUTPUT_DIR / "learning_log.sqlite3"CHART_SVG = OUTPUT_DIR / "topic_minutes.svg"REPORT_HTML = OUTPUT_DIR / "report.html"CLEANING_LOG = OUTPUT_DIR / "cleaning_log.json"
FIELDNAMES = ["date", "topic", "minutes", "status", "confidence", "note"]
RAW_ROWS = [    {"date": "2026-05-01", "topic": "Python", "minutes": "45", "status": "completed", "confidence": "0.92", "note": "loops and conditions"},    {"date": "2026-05-01", "topic": " pandas ", "minutes": "30", "status": "stuck", "confidence": "0.55", "note": "merge confusion"},    {"date": "2026-05-02", "topic": "Python", "minutes": "60", "status": "completed", "confidence": "0.88", "note": "functions"},    {"date": "2026-05-02", "topic": "SQL", "minutes": "35", "status": "completed", "confidence": "0.81", "note": "select and where"},    {"date": "2026-05-03", "topic": "Pandas", "minutes": "", "status": "stuck", "confidence": "0.40", "note": "forgot to track time"},    {"date": "2026-05-03", "topic": "Visualization", "minutes": "50", "status": "completed", "confidence": "0.76", "note": "bar chart"},    {"date": "2026-05-04", "topic": "sql", "minutes": "-10", "status": "completed", "confidence": "0.70", "note": "timer entered backwards"},    {"date": "2026-05-04", "topic": "Pandas", "minutes": "40", "status": "completed", "confidence": "0.66", "note": "groupby practice"},    {"date": "2026-05-05", "topic": "Python", "minutes": "45", "status": "completed", "confidence": "0.82", "note": "list comprehension"},    {"date": "2026-05-05", "topic": "Python", "minutes": "45", "status": "completed", "confidence": "0.82", "note": "list comprehension"},    {"date": "2026-05-05", "topic": "RAG", "minutes": "25", "status": "stuck", "confidence": "0.50", "note": "chunking terms"},    {"date": "2026-05-06", "topic": "Visualization", "minutes": "65", "status": "completed", "confidence": "0.91", "note": "line chart"},]

def normalize_topic(value: str) -> str:    aliases = {        "python": "Python",        "pandas": "Pandas",        "sql": "SQL",        "visualization": "Visualization",        "rag": "RAG",    }    cleaned = value.strip().lower()    return aliases.get(cleaned, cleaned.title())

def parse_positive_minutes(value: str) -> int | None:    try:        minutes = int(value)    except (TypeError, ValueError):        return None    if minutes <= 0:        return None    return minutes

def parse_confidence(value: str) -> float:    try:        confidence = float(value)    except (TypeError, ValueError):        return 0.0    return max(0.0, min(confidence, 1.0))

def write_raw_csv() -> None:    OUTPUT_DIR.mkdir(exist_ok=True)    with RAW_CSV.open("w", encoding="utf-8", newline="") as file:        writer = csv.DictWriter(file, fieldnames=FIELDNAMES)        writer.writeheader()        writer.writerows(RAW_ROWS)

def load_and_clean(path: Path) -> tuple[list[dict[str, object]], list[dict[str, object]]]:    clean_rows: list[dict[str, object]] = []    cleaning_log: list[dict[str, object]] = []    seen: set[tuple[object, ...]] = set()
    with path.open(encoding="utf-8", newline="") as file:        reader = csv.DictReader(file)        for line_number, row in enumerate(reader, start=2):            topic = normalize_topic(row["topic"])            status = row["status"].strip().lower()            minutes = parse_positive_minutes(row["minutes"])            confidence = parse_confidence(row["confidence"])            note = row["note"].strip()
            if minutes is None:                cleaning_log.append({"line": line_number, "action": "drop", "reason": "minutes is missing, non-numeric, or <= 0", "row": row})                continue
            key = (row["date"].strip(), topic, minutes, status, note)            if key in seen:                cleaning_log.append({"line": line_number, "action": "drop", "reason": "duplicate learning record", "row": row})                continue            seen.add(key)
            clean_rows.append(                {                    "date": row["date"].strip(),                    "topic": topic,                    "minutes": minutes,                    "status": status,                    "confidence": confidence,                    "note": note,                }            )
    return clean_rows, cleaning_log

def write_clean_csv(rows: list[dict[str, object]]) -> None:    with CLEAN_CSV.open("w", encoding="utf-8", newline="") as file:        writer = csv.DictWriter(file, fieldnames=FIELDNAMES)        writer.writeheader()        writer.writerows(rows)

def summarize_by_topic(rows: list[dict[str, object]]) -> list[dict[str, object]]:    buckets: dict[str, dict[str, object]] = defaultdict(lambda: {"minutes": 0, "sessions": 0, "completed": 0, "confidence_values": []})    for row in rows:        topic = str(row["topic"])        buckets[topic]["minutes"] = int(buckets[topic]["minutes"]) + int(row["minutes"])        buckets[topic]["sessions"] = int(buckets[topic]["sessions"]) + 1        buckets[topic]["completed"] = int(buckets[topic]["completed"]) + (1 if row["status"] == "completed" else 0)        buckets[topic]["confidence_values"].append(float(row["confidence"]))
    summary = []    for topic, values in buckets.items():        sessions = int(values["sessions"])        completed = int(values["completed"])        confidence_values = values["confidence_values"]        summary.append(            {                "topic": topic,                "minutes": int(values["minutes"]),                "sessions": sessions,                "completion_rate": round(completed / sessions * 100, 1),                "avg_confidence": round(mean(confidence_values), 2),            }        )    return sorted(summary, key=lambda item: (-int(item["minutes"]), str(item["topic"])))

def write_cleaning_log(cleaning_log: list[dict[str, object]]) -> None:    CLEANING_LOG.write_text(json.dumps(cleaning_log, ensure_ascii=False, indent=2), encoding="utf-8")

def write_sqlite(rows: list[dict[str, object]]) -> None:    with sqlite3.connect(DATABASE) as conn:        conn.execute("DROP TABLE IF EXISTS learning_logs")        conn.execute(            """            CREATE TABLE learning_logs (                date TEXT NOT NULL,                topic TEXT NOT NULL,                minutes INTEGER NOT NULL,                status TEXT NOT NULL,                confidence REAL NOT NULL,                note TEXT NOT NULL            )            """        )        conn.executemany(            """            INSERT INTO learning_logs (date, topic, minutes, status, confidence, note)            VALUES (:date, :topic, :minutes, :status, :confidence, :note)            """,            rows,        )

def query_sqlite_top_topics() -> list[tuple[str, int, float]]:    with sqlite3.connect(DATABASE) as conn:        return conn.execute(            """            SELECT topic, SUM(minutes) AS total_minutes, ROUND(AVG(confidence), 2) AS avg_confidence            FROM learning_logs            GROUP BY topic            ORDER BY total_minutes DESC            LIMIT 3            """        ).fetchall()

def write_svg_bar_chart(summary: list[dict[str, object]]) -> None:    max_minutes = max(int(item["minutes"]) for item in summary)    width = 860    height = 120 + len(summary) * 74    left = 180    bar_max_width = 540    colors = ["#2563eb", "#0f766e", "#dc2626", "#7c3aed", "#ea580c"]    lines = [        f'<svg xmlns="http://www.w3.org/2000/svg" width="{width}" height="{height}" viewBox="0 0 {width} {height}">',        '<rect width="100%" height="100%" fill="#f8fafc"/>',        '<text x="32" y="48" font-family="Arial, sans-serif" font-size="26" font-weight="700" fill="#0f172a">Study minutes by topic</text>',        '<text x="32" y="78" font-family="Arial, sans-serif" font-size="15" fill="#475569">Cleaned learning-log records, grouped by topic</text>',    ]    for index, item in enumerate(summary):        y = 112 + index * 74        topic = html.escape(str(item["topic"]))        minutes = int(item["minutes"])        bar_width = int(minutes / max_minutes * bar_max_width)        color = colors[index % len(colors)]        lines.extend(            [                f'<text x="32" y="{y + 27}" font-family="Arial, sans-serif" font-size="18" fill="#0f172a">{topic}</text>',                f'<rect x="{left}" y="{y}" width="{bar_max_width}" height="34" rx="8" fill="#e2e8f0"/>',                f'<rect x="{left}" y="{y}" width="{bar_width}" height="34" rx="8" fill="{color}"/>',                f'<text x="{left + bar_max_width + 20}" y="{y + 24}" font-family="Arial, sans-serif" font-size="17" fill="#0f172a">{minutes} min</text>',            ]        )    lines.append("</svg>")    CHART_SVG.write_text("\n".join(lines), encoding="utf-8")

def write_report(summary: list[dict[str, object]], sql_rows: list[tuple[str, int, float]], cleaning_log: list[dict[str, object]]) -> None:    total_minutes = sum(int(item["minutes"]) for item in summary)    rows_html = "\n".join(        f"<tr><td>{html.escape(str(item['topic']))}</td><td>{item['minutes']}</td><td>{item['sessions']}</td><td>{item['completion_rate']}%</td><td>{item['avg_confidence']}</td></tr>"        for item in summary    )    sql_html = "\n".join(        f"<li><strong>{html.escape(topic)}</strong>: {minutes} minutes, average confidence {confidence}</li>"        for topic, minutes, confidence in sql_rows    )    REPORT_HTML.write_text(        f"""<!doctype html><html lang="en"><head>  <meta charset="utf-8" />  <title>Learning Log Analysis Report</title>  <style>    body {{ font-family: Arial, sans-serif; max-width: 960px; margin: 32px auto; color: #0f172a; line-height: 1.6; }}    .cards {{ display: grid; grid-template-columns: repeat(3, 1fr); gap: 12px; }}    .card {{ background: #eef2ff; border-radius: 12px; padding: 16px; }}    table {{ width: 100%; border-collapse: collapse; margin-top: 16px; }}    th, td {{ border-bottom: 1px solid #cbd5e1; text-align: left; padding: 10px; }}    img {{ max-width: 100%; border: 1px solid #e2e8f0; border-radius: 12px; }}  </style></head><body>  <h1>Learning Log Analysis Report</h1>  <p>This report was generated from a dirty CSV, then cleaned, summarized, queried with SQLite, and visualized.</p>  <section class="cards">    <div class="card"><strong>Total minutes</strong><br>{total_minutes}</div>    <div class="card"><strong>Clean topics</strong><br>{len(summary)}</div>    <div class="card"><strong>Dropped rows</strong><br>{len(cleaning_log)}</div>  </section>  <h2>Chart</h2>  <img src="topic_minutes.svg" alt="Study minutes by topic" />  <h2>Topic Summary</h2>  <table>    <tr><th>Topic</th><th>Minutes</th><th>Sessions</th><th>Completion rate</th><th>Avg confidence</th></tr>    {rows_html}  </table>  <h2>SQLite top topics</h2>  <ul>{sql_html}</ul>  <h2>Conclusion</h2>  <p>Python has the highest total study time. Visualization is also strong, but Pandas has lower confidence, so the next practice should focus on Pandas grouping and merging.</p></body></html>""".strip(),        encoding="utf-8",    )

def main() -> None:    write_raw_csv()    clean_rows, cleaning_log = load_and_clean(RAW_CSV)    summary = summarize_by_topic(clean_rows)    write_clean_csv(clean_rows)    write_cleaning_log(cleaning_log)    write_sqlite(clean_rows)    sql_rows = query_sqlite_top_topics()    write_svg_bar_chart(summary)    write_report(summary, sql_rows, cleaning_log)
    total_minutes = sum(int(row["minutes"]) for row in clean_rows)    completed_rows = sum(1 for row in clean_rows if row["status"] == "completed")    completion_rate = completed_rows / len(clean_rows) * 100    top_topic = summary[0]
    print(f"Raw rows: {len(RAW_ROWS)}")    print(f"Clean rows: {len(clean_rows)}")    print(f"Dropped rows: {len(cleaning_log)}")    print(f"Total study minutes: {total_minutes}")    print(f"Completion rate: {completion_rate:.1f}%")    print(f"Top topic: {top_topic['topic']} ({top_topic['minutes']} min)")    print("\nTop 3 topics from SQLite:")    for topic, minutes, confidence in sql_rows:        print(f"- {topic}: {minutes} min, avg confidence {confidence}")    print("\nGenerated files:")    for path in [RAW_CSV, CLEAN_CSV, CLEANING_LOG, DATABASE, CHART_SVG, REPORT_HTML]:        print(f"- {path.as_posix()}")

if __name__ == "__main__":    main()
Step 3: Run it and compare the output
Section titled “Step 3: Run it and compare the output”python3 learning_log_pipeline.pyExpected output:
Raw rows: 12Clean rows: 9Dropped rows: 3Total study minutes: 395Completion rate: 77.8%Top topic: Python (150 min)
Top 3 topics from SQLite:- Python: 150 min, avg confidence 0.87- Visualization: 115 min, avg confidence 0.83- Pandas: 70 min, avg confidence 0.6
Generated files:- ch03_output/raw_learning_log.csv- ch03_output/clean_learning_log.csv- ch03_output/cleaning_log.json- ch03_output/learning_log.sqlite3- ch03_output/topic_minutes.svg- ch03_output/report.html
If your output matches the counts, the pipeline is working.
Step 4: Read the generated evidence
Section titled “Step 4: Read the generated evidence”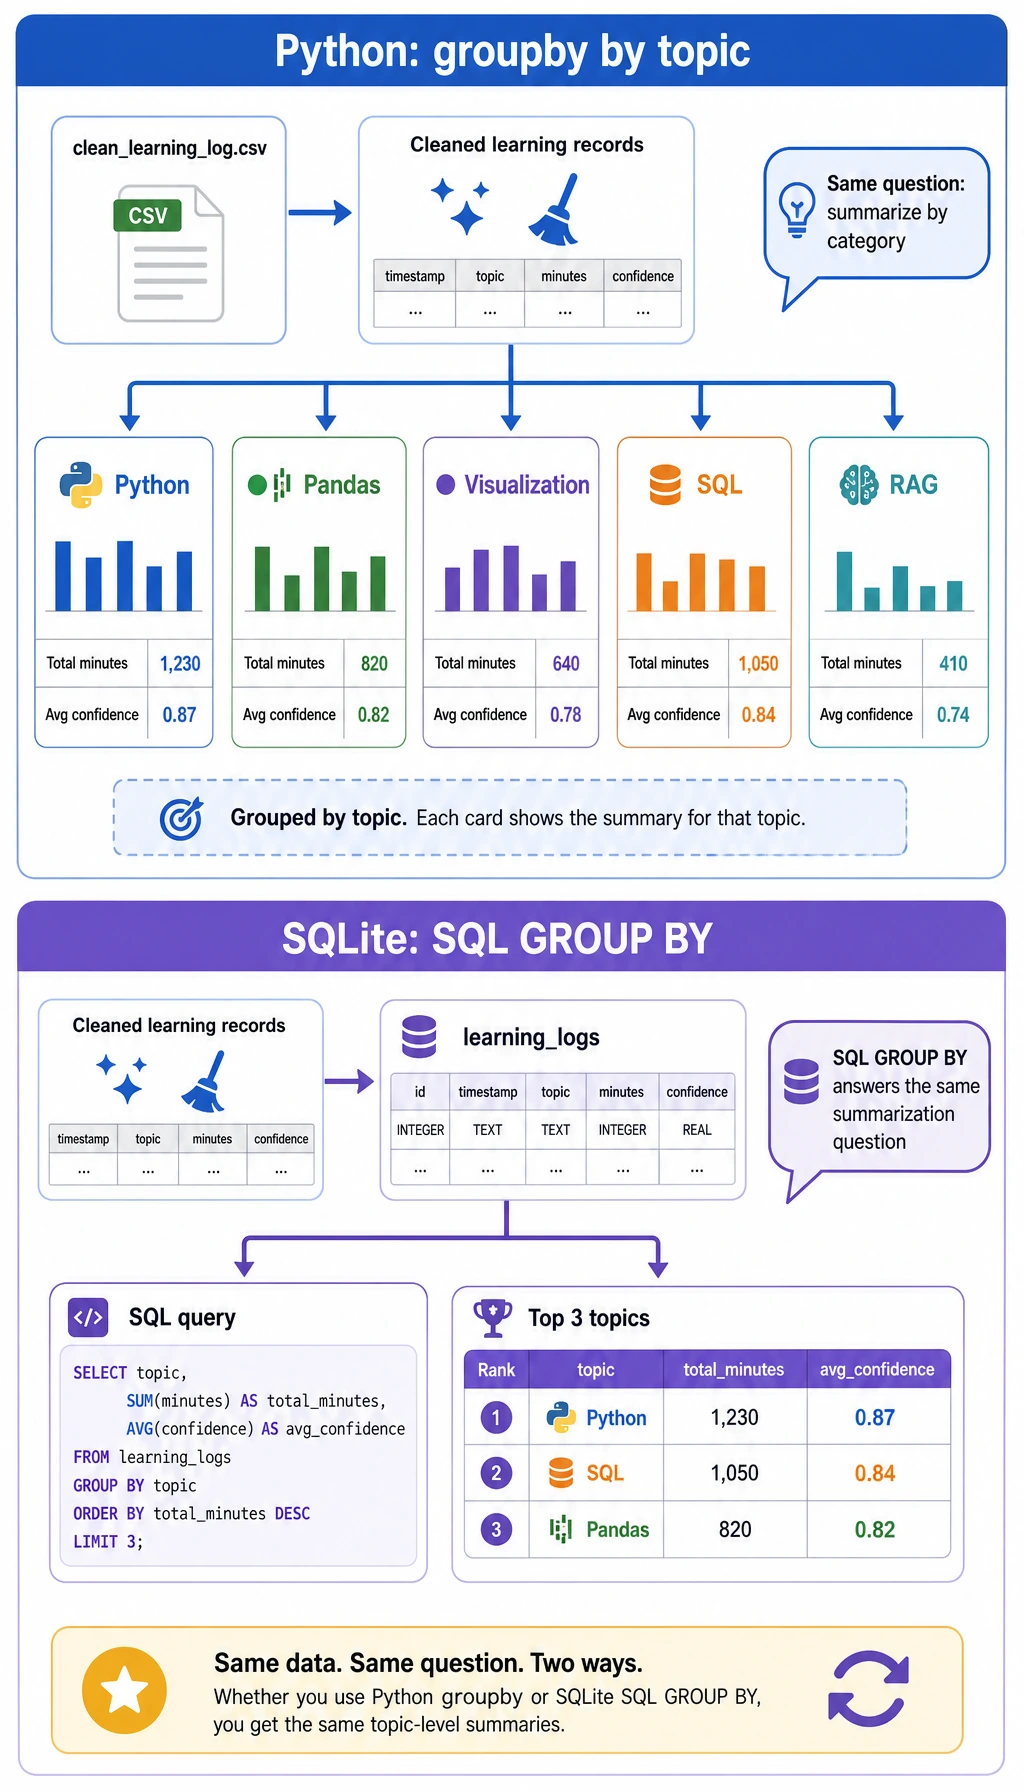
Open ch03_output/cleaning_log.json first. It should show three dropped rows: one missing minutes, one negative minutes, and one duplicate record. This file is important because data cleaning without a record is hard to trust later.
Then inspect the cleaned CSV:
python3 - <<'PY'import csv
with open("ch03_output/clean_learning_log.csv", encoding="utf-8", newline="") as file:    rows = list(csv.DictReader(file))
print(rows[0])print("rows:", len(rows))PY
Expected output:
{'date': '2026-05-01', 'topic': 'Python', 'minutes': '45', 'status': 'completed', 'confidence': '0.92', 'note': 'loops and conditions'}rows: 9Now query the SQLite database directly:
python3 - <<'PY'import sqlite3
with sqlite3.connect("ch03_output/learning_log.sqlite3") as conn:    for row in conn.execute("SELECT topic, SUM(minutes) FROM learning_logs GROUP BY topic ORDER BY SUM(minutes) DESC"):        print(row)PY
Expected output:
('Python', 150)('Visualization', 115)('Pandas', 70)('SQL', 35)('RAG', 25)Step 5: Open the chart and report
Section titled “Step 5: Open the chart and report”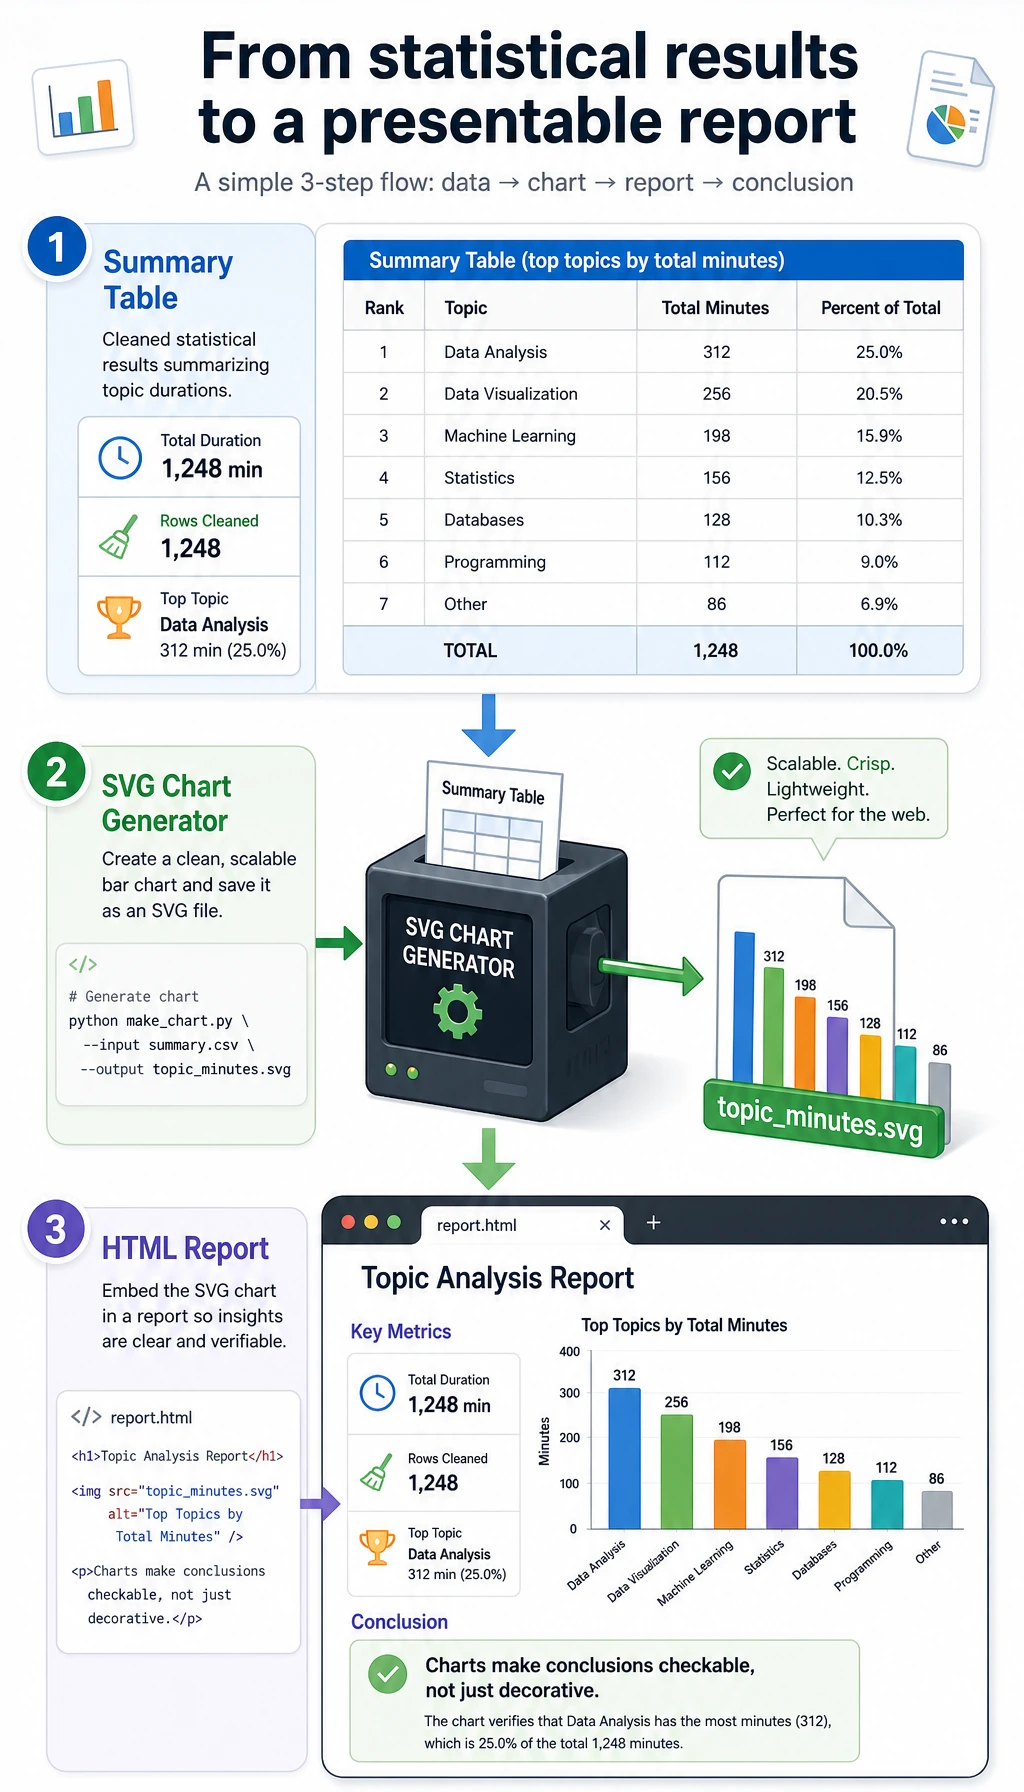
Open the HTML report:
# macOSopen ch03_output/report.html
# Windows PowerShellstart ch03_output/report.html
# Linuxxdg-open ch03_output/report.html
The report is intentionally simple. Its purpose is not visual polish; its purpose is to prove that every number can be traced back to a cleaned row and every conclusion can be checked.
Why these concepts matter
Section titled “Why these concepts matter”| Term | Beginner-friendly meaning |
|---|---|
CSV | A plain-text table file. It is easy to inspect, but it does not enforce data quality. |
cleaning log | A record of what changed during cleaning and why. It protects your conclusion from becoming a black box. |
grouped statistics | Split rows by a category, calculate a metric for each group, then compare groups. |
SQLite | A small file-based relational database included with Python through sqlite3. |
SVG | A text-based image format. Here we generate a chart without installing a plotting library. |
| reproducibility | Another person can run the same script and get the same files and numbers. |
Evidence to Keep
Section titled “Evidence to Keep”Keep this page’s proof of learning as a small evidence card:
- Analysis Goal
- business/data question and success criterion
- Data Evidence
- source, cleaning notes, features, and chart/table outputs
- Result
- insight, metric, dashboard, or report section
- Failure Check
- dirty data, biased sample, wrong aggregation, or unreproducible notebook
- Expected Output
- reproducible analysis folder with data, charts, and a short report
Common mistakes and fixes
Section titled “Common mistakes and fixes”| Problem | Likely cause | Fix |
|---|---|---|
python3: command not found | Your system uses python instead of python3 | Run python --version, then use python learning_log_pipeline.py |
| Output count is different | The script was edited accidentally | Copy the script again and rerun from a clean folder |
report.html opens but chart is missing | The HTML file was moved away from topic_minutes.svg | Keep both files inside ch03_output/ |
| SQLite query returns old data | A previous database file was reused by another script | This script drops and recreates the table; rerun the whole script |
| You know the API but not the conclusion | You focused on methods, not evidence | Read cleaning_log.json, clean_learning_log.csv, and report.html in that order |
Mini exercises
Section titled “Mini exercises”- Add a new row for
Machine Learningwithminutesgreater than0, rerun the script, and check whether the chart changes. - Add a row with
confidenceequal to1.2. Confirm thatparse_confidence()clips it to1.0. - Change the SQLite query to show only rows where
status = 'stuck'. - Add a new field named
difficultyand include it in the CSV, SQLite table, and report. - Rewrite
summarize_by_topic()with Pandas after you finish the Pandas section, then compare the result with this standard-library version.
Operation guide and checkpoints
- For the table-editing mini exercises, expected evidence is the changed CSV or SQLite table plus the exact query or Pandas statement that proves the change.
- If a confidence value can exceed the valid range, clip or validate it and record the rule. A hidden invalid value is worse than a visible warning.
- When adding a new field such as difficulty, update the CSV, database schema, loading code, and report output together so the data path stays consistent end to end.
Portfolio evidence checklist
Section titled “Portfolio evidence checklist”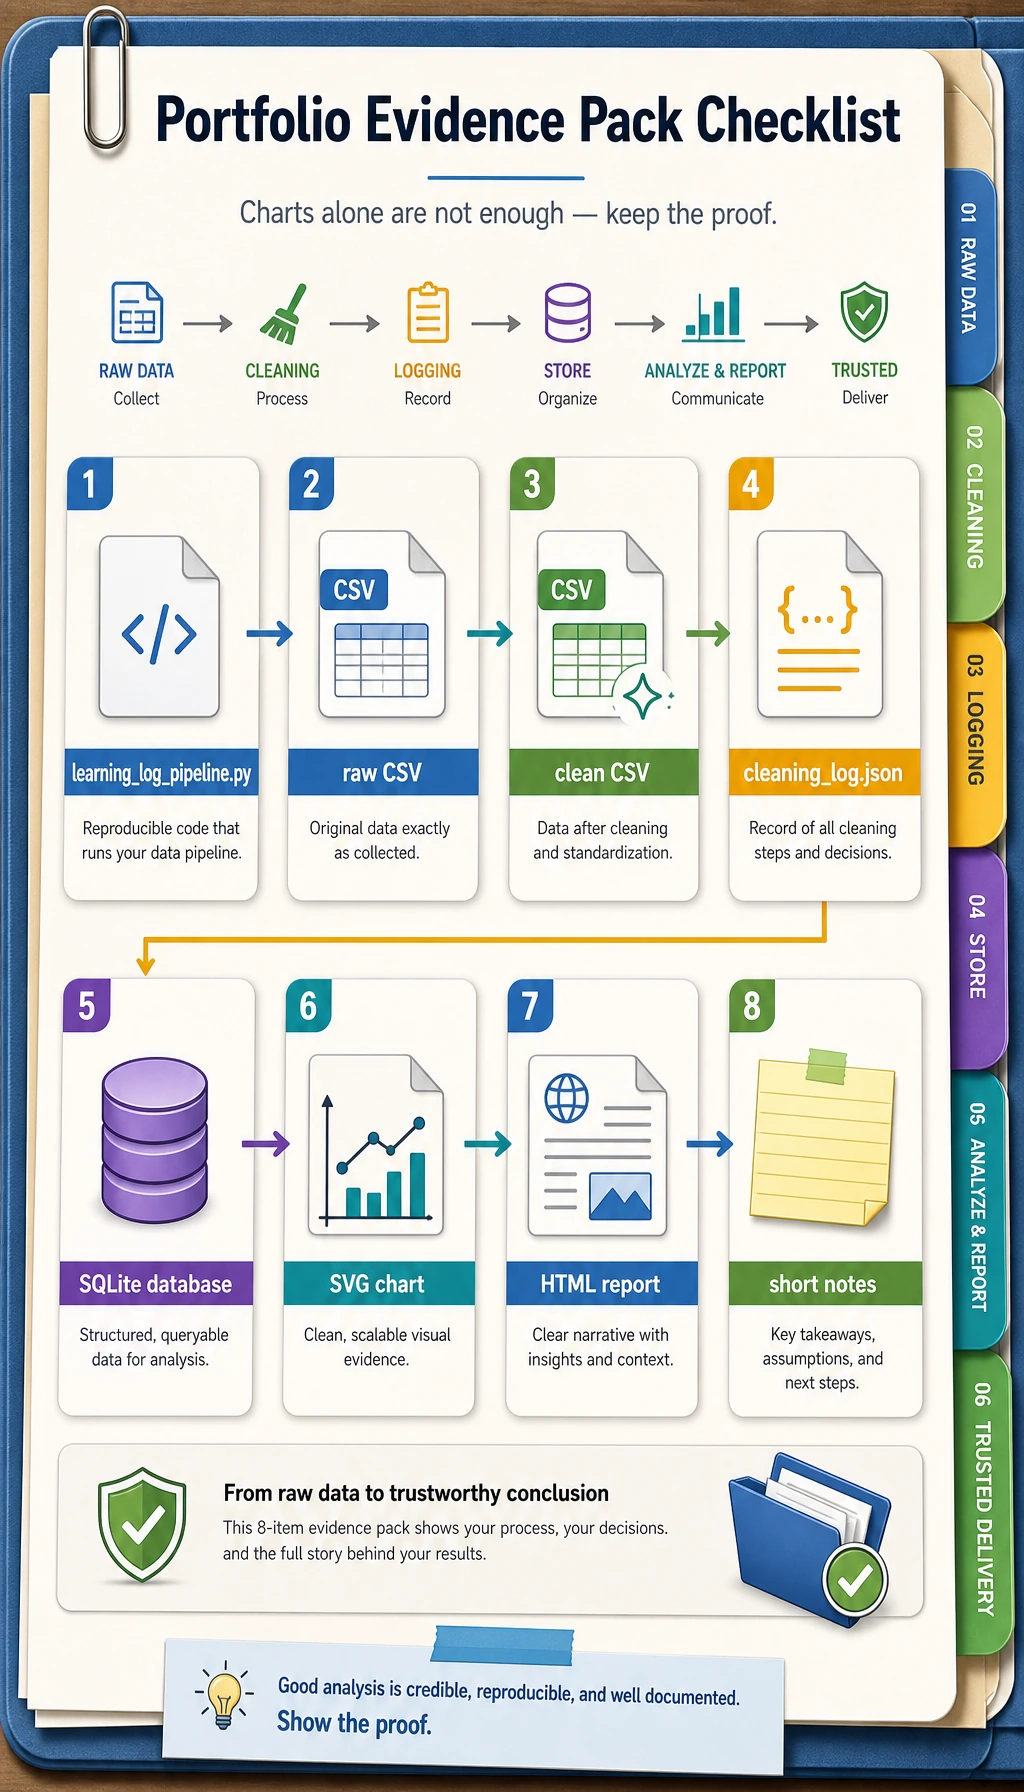
When you use this workshop as portfolio practice, keep these materials:
- The script:
learning_log_pipeline.py - The raw input:
raw_learning_log.csv - The cleaned output:
clean_learning_log.csv - The cleaning record:
cleaning_log.json - The database:
learning_log.sqlite3 - The chart:
topic_minutes.svg - The report:
report.html - A short note explaining what was dropped, which topic ranked first, and what you would analyze next
This is the minimum professional habit for data work: do not only show the final chart; show the path that made the chart trustworthy.