
5.4.2 Evaluation Metrics
What You Will Build
Section titled “What You Will Build”This lesson gives you one evaluation lab:
- expose the accuracy trap on imbalanced classification;
- tune thresholds and read false positives/false negatives;
- compare ROC AUC and average precision;
- evaluate regression with MAE, RMSE, and R2;
- choose metrics from product cost, not from habit.
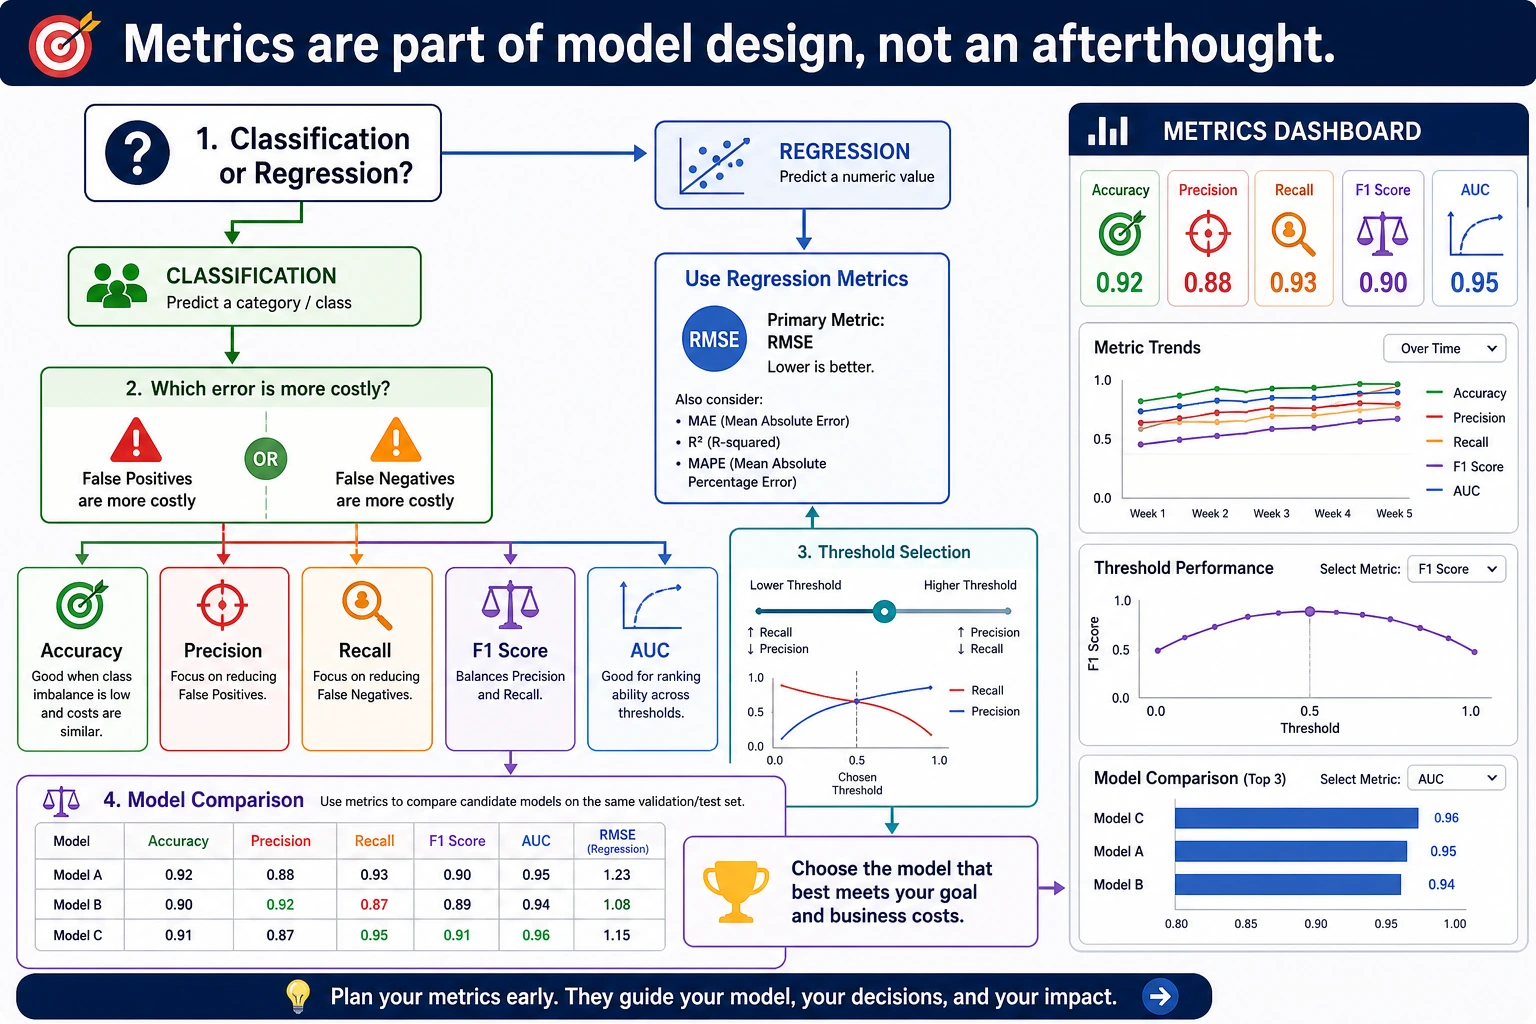
Start with the map:
Keyword Decoder
Section titled “Keyword Decoder”| Term | Practical meaning |
|---|---|
TP | true positive: real positive and predicted positive |
FP | false positive: real negative but predicted positive |
FN | false negative: real positive but missed |
precision | among predicted positives, how many were really positive |
recall | among real positives, how many were found |
F1 | harmonic mean of precision and recall |
ROC AUC | ranking quality over many thresholds; can look optimistic on rare positives |
average_precision | precision-recall area; often better for imbalanced positive classes |
MAE | average absolute regression error |
RMSE | square-root mean squared error; punishes large misses more |
python -m pip install -U scikit-learnRun the Complete Lab
Section titled “Run the Complete Lab”Create metrics_lab.py:
from sklearn.datasets import load_diabetes, make_classificationfrom sklearn.dummy import DummyClassifier, DummyRegressorfrom sklearn.linear_model import LinearRegression, LogisticRegressionfrom sklearn.metrics import (    accuracy_score,    average_precision_score,    confusion_matrix,    f1_score,    mean_absolute_error,    mean_squared_error,    precision_score,    r2_score,    recall_score,    roc_auc_score,)from sklearn.model_selection import train_test_splitfrom sklearn.pipeline import Pipelinefrom sklearn.preprocessing import StandardScaler

X, y = make_classification(    n_samples=1200,    n_features=12,    n_informative=5,    n_redundant=2,    weights=[0.92, 0.08],    class_sep=1.2,    random_state=42,)X_train, X_test, y_train, y_test = train_test_split(    X, y, test_size=0.25, random_state=42, stratify=y)
baseline = DummyClassifier(strategy="most_frequent")baseline.fit(X_train, y_train)base_pred = baseline.predict(X_test)print("classification_baseline")print(f"accuracy={accuracy_score(y_test, base_pred):.3f}")print(f"precision={precision_score(y_test, base_pred, zero_division=0):.3f}")print(f"recall={recall_score(y_test, base_pred):.3f}")
model = Pipeline([    ("scale", StandardScaler()),    ("clf", LogisticRegression(max_iter=2000, random_state=42)),])model.fit(X_train, y_train)prob = model.predict_proba(X_test)[:, 1]
print("threshold_lab")for threshold in [0.2, 0.5, 0.8]:    pred = (prob >= threshold).astype(int)    tn, fp, fn, tp = confusion_matrix(y_test, pred).ravel()    print(        f"threshold={threshold:.1f} "        f"accuracy={accuracy_score(y_test, pred):.3f} "        f"precision={precision_score(y_test, pred, zero_division=0):.3f} "        f"recall={recall_score(y_test, pred):.3f} "        f"f1={f1_score(y_test, pred):.3f} "        f"fp={fp} fn={fn}"    )print(f"roc_auc={roc_auc_score(y_test, prob):.3f}")print(f"average_precision={average_precision_score(y_test, prob):.3f}")
print("regression_lab")X, y = load_diabetes(return_X_y=True)X_train, X_test, y_train, y_test = train_test_split(    X, y, test_size=0.25, random_state=42)for name, reg in [    ("mean_baseline", DummyRegressor(strategy="mean")),    ("linear", LinearRegression()),]:    reg.fit(X_train, y_train)    pred = reg.predict(X_test)    rmse = mean_squared_error(y_test, pred) ** 0.5    print(        f"{name:<13} "        f"mae={mean_absolute_error(y_test, pred):.1f} "        f"rmse={rmse:.1f} "        f"r2={r2_score(y_test, pred):.3f}"    )
Run it:
python metrics_lab.pyExpected output:
classification_baselineaccuracy=0.917precision=0.000recall=0.000threshold_labthreshold=0.2 accuracy=0.907 precision=0.462 recall=0.720 f1=0.562 fp=21 fn=7threshold=0.5 accuracy=0.943 precision=0.833 recall=0.400 f1=0.541 fp=2 fn=15threshold=0.8 accuracy=0.923 precision=1.000 recall=0.080 f1=0.148 fp=0 fn=23roc_auc=0.889average_precision=0.660regression_labmean_baseline mae=65.5 rmse=74.9 r2=-0.014linear mae=41.5 rmse=53.4 r2=0.485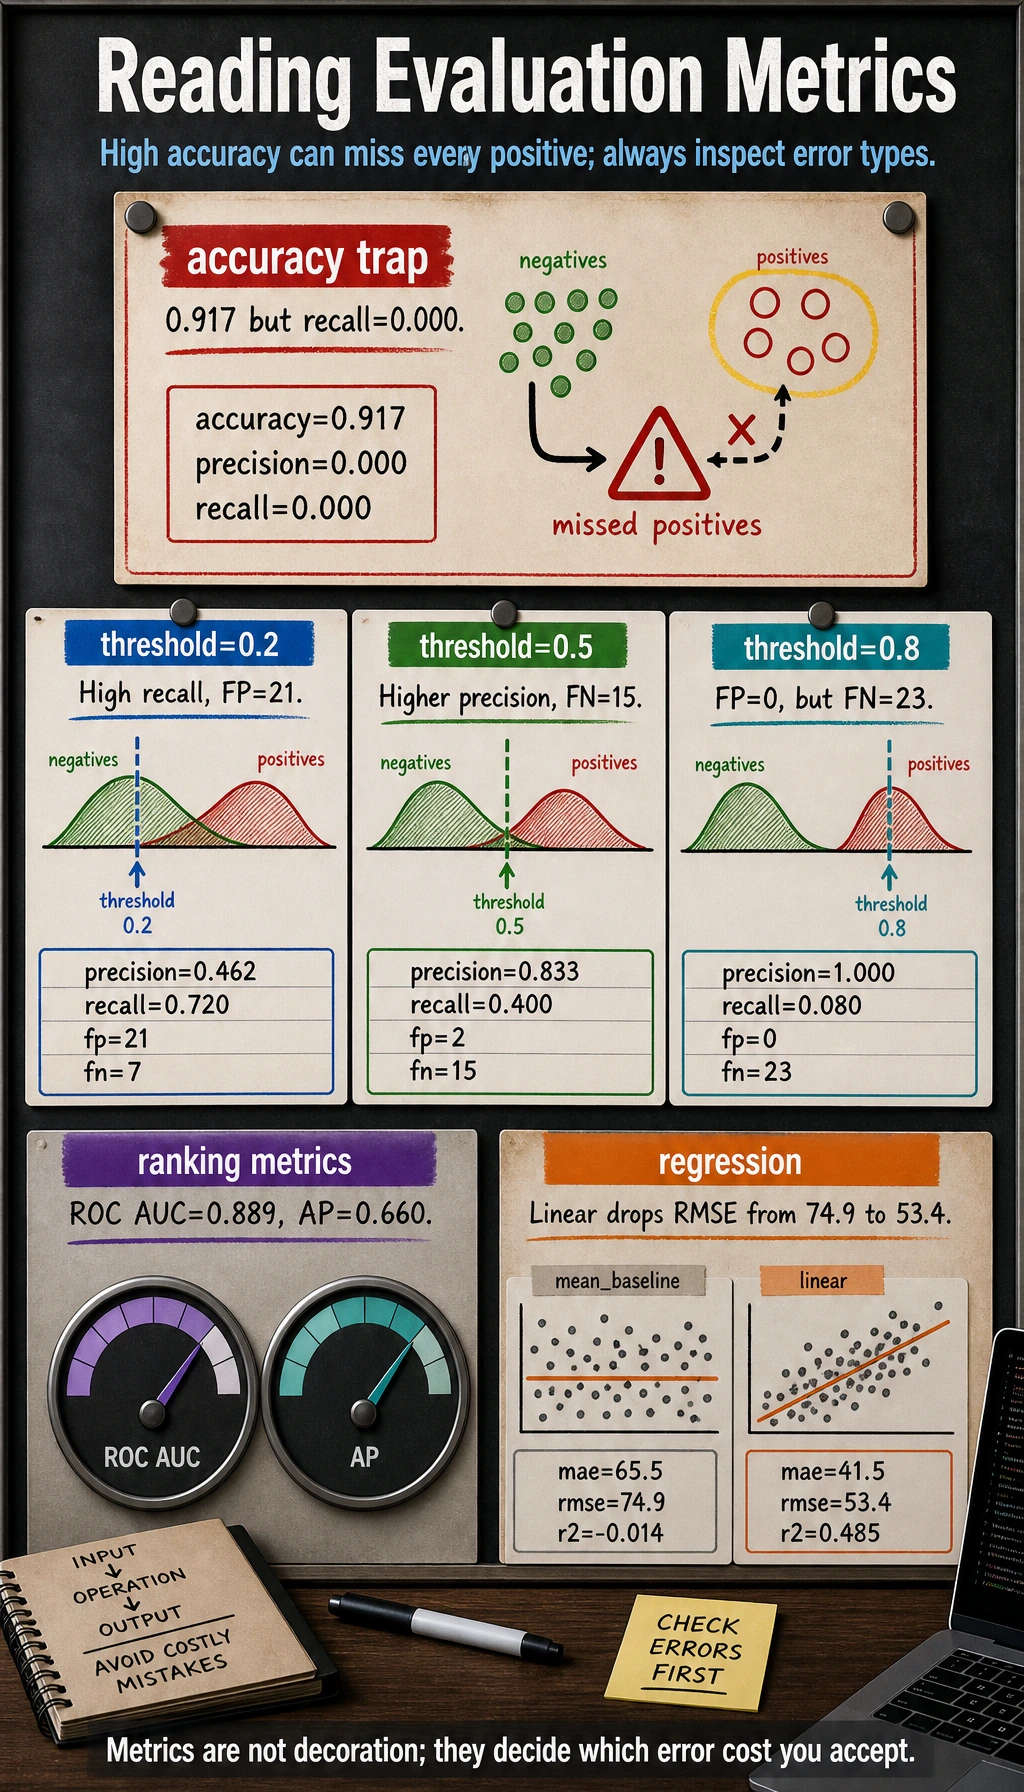
The Accuracy Trap
Section titled “The Accuracy Trap”The baseline predicts the majority class every time:
accuracy=0.917precision=0.000recall=0.000That looks like a high accuracy score, but it finds zero positive cases. For imbalanced classification, accuracy alone can be actively misleading.
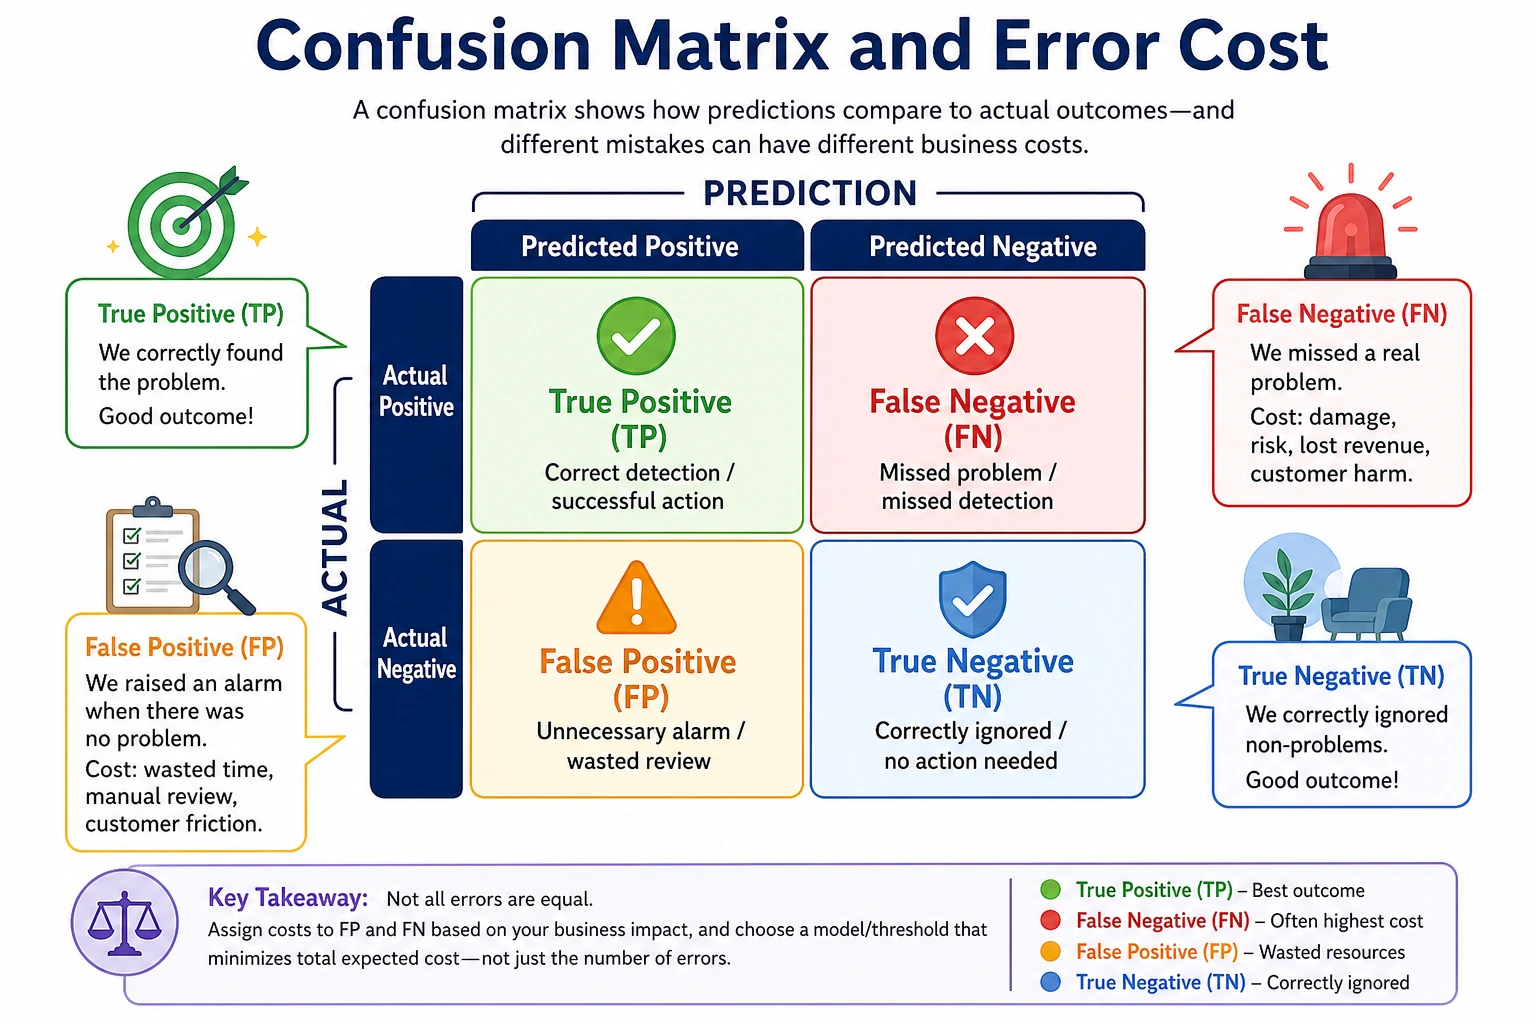
Confusion Matrix First
Section titled “Confusion Matrix First”Every classification metric comes from four counts:
| Count | Meaning |
|---|---|
TP | positive case correctly found |
FP | normal case incorrectly flagged |
FN | positive case missed |
TN | normal case correctly ignored |
Before choosing a metric, ask:
- Is
FPmore expensive, or isFNmore expensive? - Is the model used for screening, ranking, blocking, or final decision?
- How many cases can humans review?
Thresholds Change the Story
Section titled “Thresholds Change the Story”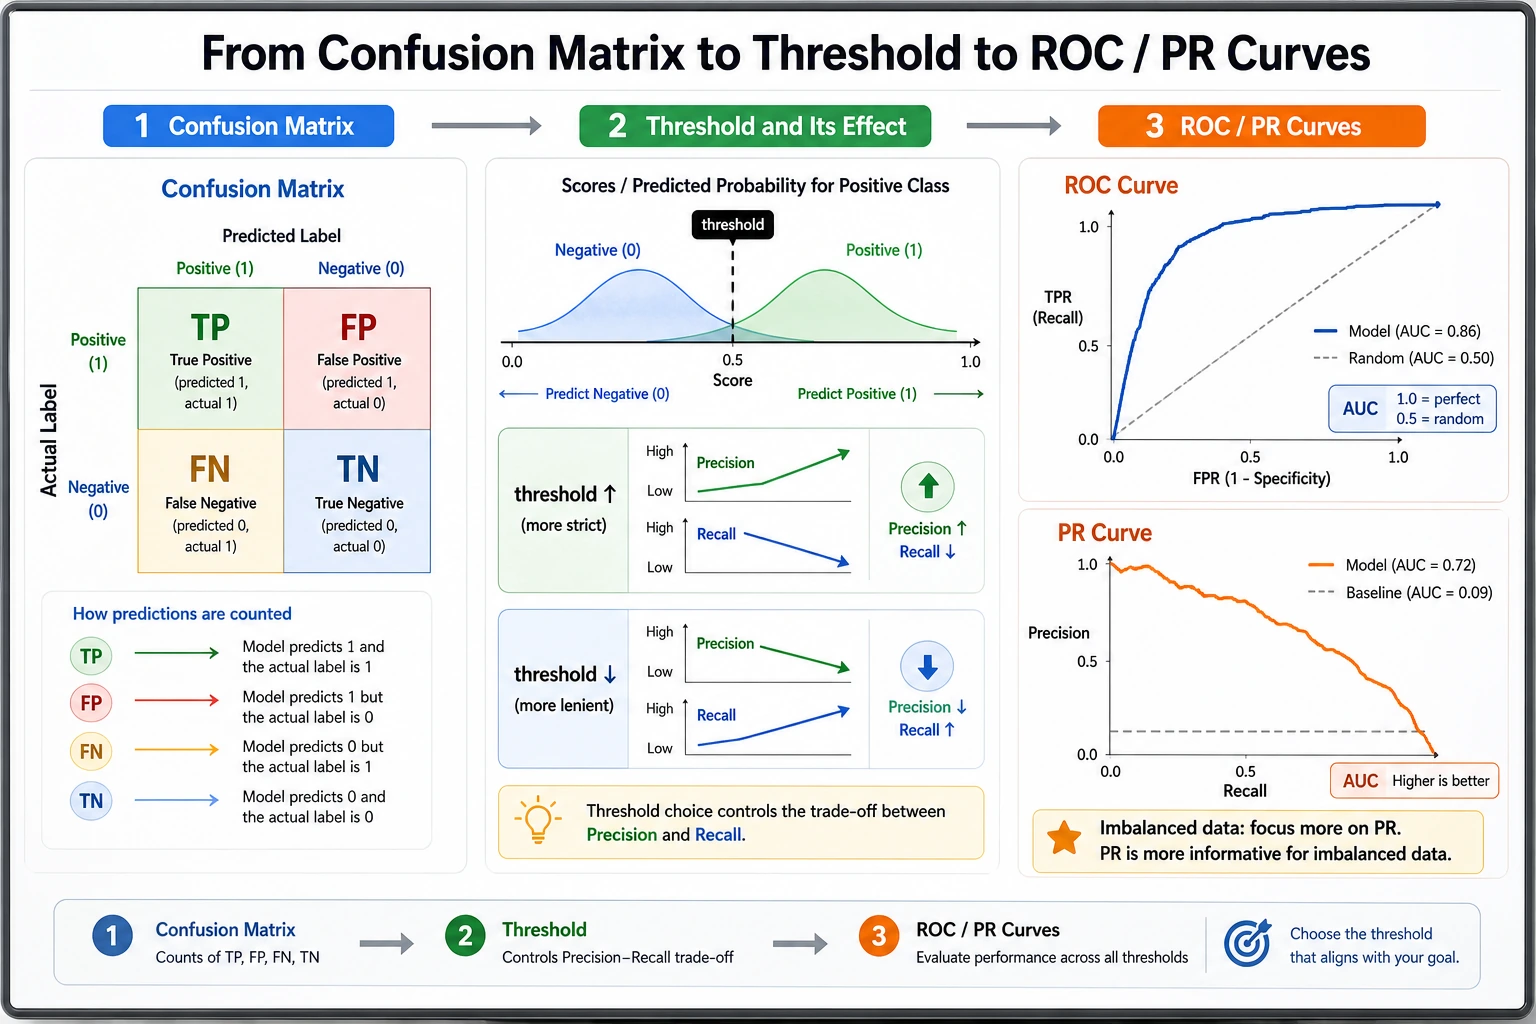
The same model gives different behavior at different thresholds:
threshold=0.2 precision=0.462 recall=0.720 fp=21 fn=7threshold=0.8 precision=1.000 recall=0.080 fp=0 fn=23Lowering the threshold catches more positives but creates more false alarms. Raising it creates fewer false alarms but misses more positives.
Use this guide:
| Product goal | Primary metric |
|---|---|
| catch as many positives as possible | recall |
| keep alerts trustworthy | precision |
| balance precision and recall | F1 |
| rank candidates across thresholds | ROC AUC |
| rare positive class | average precision / PR curve |
ROC AUC vs Average Precision
Section titled “ROC AUC vs Average Precision”roc_auc=0.889 says the model ranks positives above negatives fairly well across thresholds.
average_precision=0.660 is more strict for rare positives because it focuses on precision-recall behavior. In fraud, medical screening, security alerts, and churn rescue, always inspect precision-recall metrics, not only ROC AUC.
Regression Metrics
Section titled “Regression Metrics”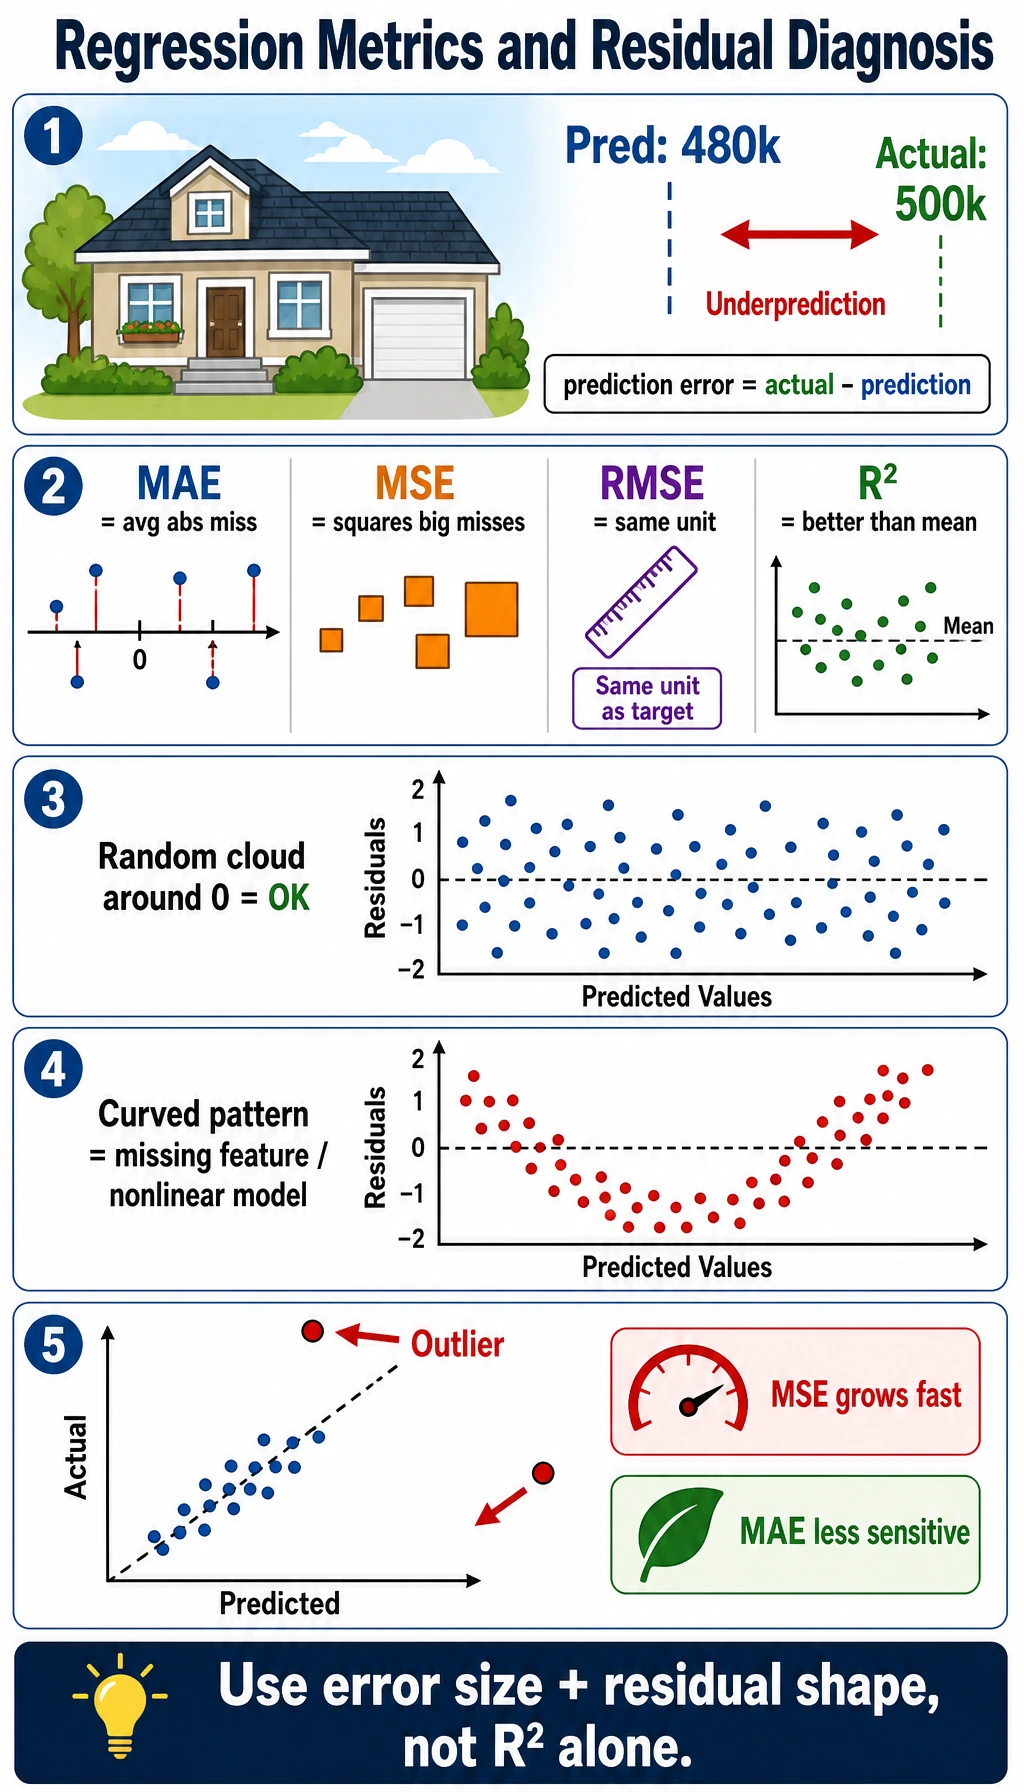
The regression lab compares a mean baseline with a linear model:
mean_baseline mae=65.5 rmse=74.9 r2=-0.014linear mae=41.5 rmse=53.4 r2=0.485Read them like this:
| Metric | Use it when |
|---|---|
MAE | you want average error in the original unit |
RMSE | large errors are especially painful |
R2 | you want to know how much better the model is than a mean baseline |
Do not rely only on R2. A model can have a decent R2 while still making unacceptable errors for important cases.
Practical Metric Selection
Section titled “Practical Metric Selection”| Task | Start with | Then check |
|---|---|---|
| Balanced classification | accuracy, F1 | confusion matrix |
| Imbalanced classification | precision, recall, F1 | PR curve, threshold table |
| Screening / detection | recall | alert volume and false positives |
| Final approval / blocking | precision | missed positives and manual review policy |
| Ranking | ROC AUC, average precision | top-k precision |
| Regression | MAE, RMSE | residual plots and segment errors |
For experienced readers: evaluate by segment. A global metric can hide failures on a region, customer group, language, device type, or rare class.
Practical Debugging Checklist
Section titled “Practical Debugging Checklist”| Symptom | Likely cause | Fix |
|---|---|---|
| High accuracy, zero recall | class imbalance | use confusion matrix and recall |
| Good ROC AUC, poor alerts | threshold too high or rare positives | inspect PR curve and alert volume |
| F1 improves but product worsens | metric does not match business cost | define FP/FN cost explicitly |
| Regression average looks fine | large errors hidden in a segment | inspect residuals by segment |
| Offline metric drops in production | distribution shift | monitor data and metric drift |
Practice
Section titled “Practice”- Change class weights to
[0.98, 0.02]. What happens to accuracy and recall? - Add thresholds
[0.1, 0.3, 0.7, 0.9]. Which threshold would you ship for screening? - Print
tp,fp,fn,tnfor every threshold. - Add a tree model and compare ROC AUC and average precision.
- For regression, print the five largest absolute errors and inspect the inputs.
Reference implementation and walkthrough
- With only 2% positives, accuracy can look excellent even if the model misses many positives. Recall and precision become more informative than raw accuracy.
- For screening, a lower threshold such as
0.1or0.3is often preferable because it reduces missed positives. The tradeoff is more false alarms, so the shipping choice depends on review capacity. - The confusion counts should move predictably: lower thresholds increase
tpandfp, while higher thresholds reducefpbut increasefn. - ROC AUC can still look strong on rare-positive data. Average precision is usually more sensitive to whether the model ranks the rare positive class well.
- The largest regression errors often reveal data quality issues, rare subgroups, or missing features. They are more useful than a single aggregate score when planning the next feature fix.
Evidence to Keep
Section titled “Evidence to Keep”Keep this page’s proof of learning as a small evidence card:
- Evaluation Setup
- split, cross-validation, metric, baseline, and comparison target
- Result
- score table, curve, confusion matrix, validation result, or search outcome
- Decision
- whether to change data, features, model, threshold, or hyperparameters
- Failure Check
- leakage, unstable validation, wrong metric, or tuning on the test set
- Expected Output
- evaluation record that supports a next modeling decision
Pass Check
Section titled “Pass Check”You are done when you can explain:
- accuracy can be misleading on imbalanced data;
- precision and recall describe different error costs;
- threshold choice is part of product design;
- ROC AUC and PR metrics answer different questions;
- regression metrics need residual and segment checks.