3.0 Study Guide and Task Sheet: Data Analysis and Visualization
The main study route is now in Chapter 3 entry. Use this page only as a quick checklist while you practice.
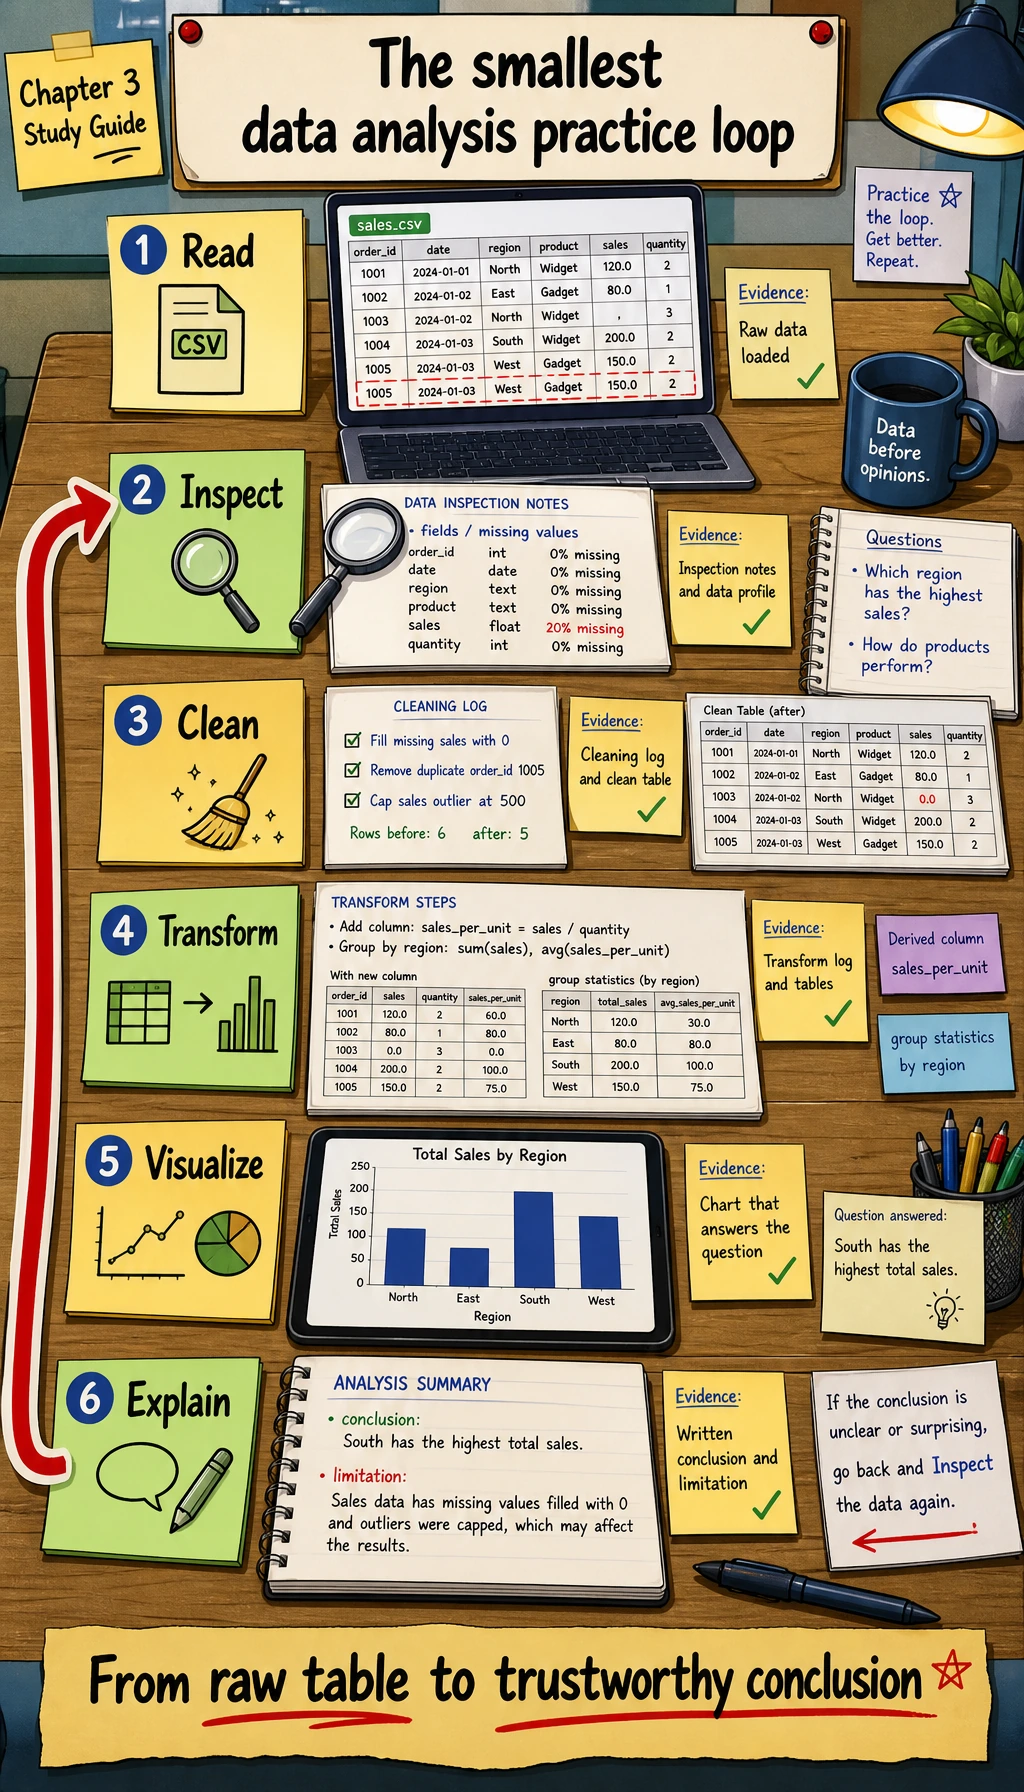
One-Line Mental Model
Section titled “One-Line Mental Model”readinspectcleansummarizevisualizeexplain
If you cannot explain a chart in one sentence, return to the data question.
Practice Checklist
Section titled “Practice Checklist”| Check | Evidence |
|---|---|
| I can inspect rows, columns, types, and missing values | df.info() and missing-value notes |
| I can clean duplicates, missing values, and obvious outliers | cleaning log |
I can use groupby to answer a question | summary table |
| I can choose a chart for a specific question | 3 chart files |
| I can state a conclusion and a limitation | report.md |
| I can finish the reproducible workshop | ch03_output/ |
Check reasoning and explanation
- Use the checklist as a final evidence audit. You should be able to point to a raw file, a cleaned file or cleaning script, a summary table, a chart, and a short conclusion for each project.
- For every conclusion, write one sentence of support and one sentence of limitation. This habit prevents overclaiming from small or messy data.
- If another learner cannot rerun your notebook or script from a fresh folder, fix paths, dependencies, and README steps before moving on.
Evidence Rubric
Section titled “Evidence Rubric”| Artifact | It should answer |
|---|---|
| Data dictionary | What does each column mean, what unit does it use, and where did it come from? |
| Cleaning log | Which rows or values changed, and why was that rule acceptable? |
| Summary table | What numeric pattern supports the answer? |
| Chart | What single question does the visual answer? |
| Limitation note | What could still be wrong because of missing data, sampling, time, or leakage? |
Ready To Continue
Section titled “Ready To Continue”Continue to Chapter 4 when one CSV can travel from raw data to cleaned data, summary table, chart, and short written conclusion.
Evidence to Keep
Section titled “Evidence to Keep”Keep this page’s proof of learning as a small evidence card:
- Data Source
- raw records or small dataset used
- Processing Step
- pure Python, NumPy, Pandas, charting, or SQL operation
- Output
- cleaned data, statistic, chart, query result, or report note
- Failure Check
- missing data, shape mismatch, wrong aggregation, or unclear question
- Expected Output
- data artifact plus the evidence needed to trust it